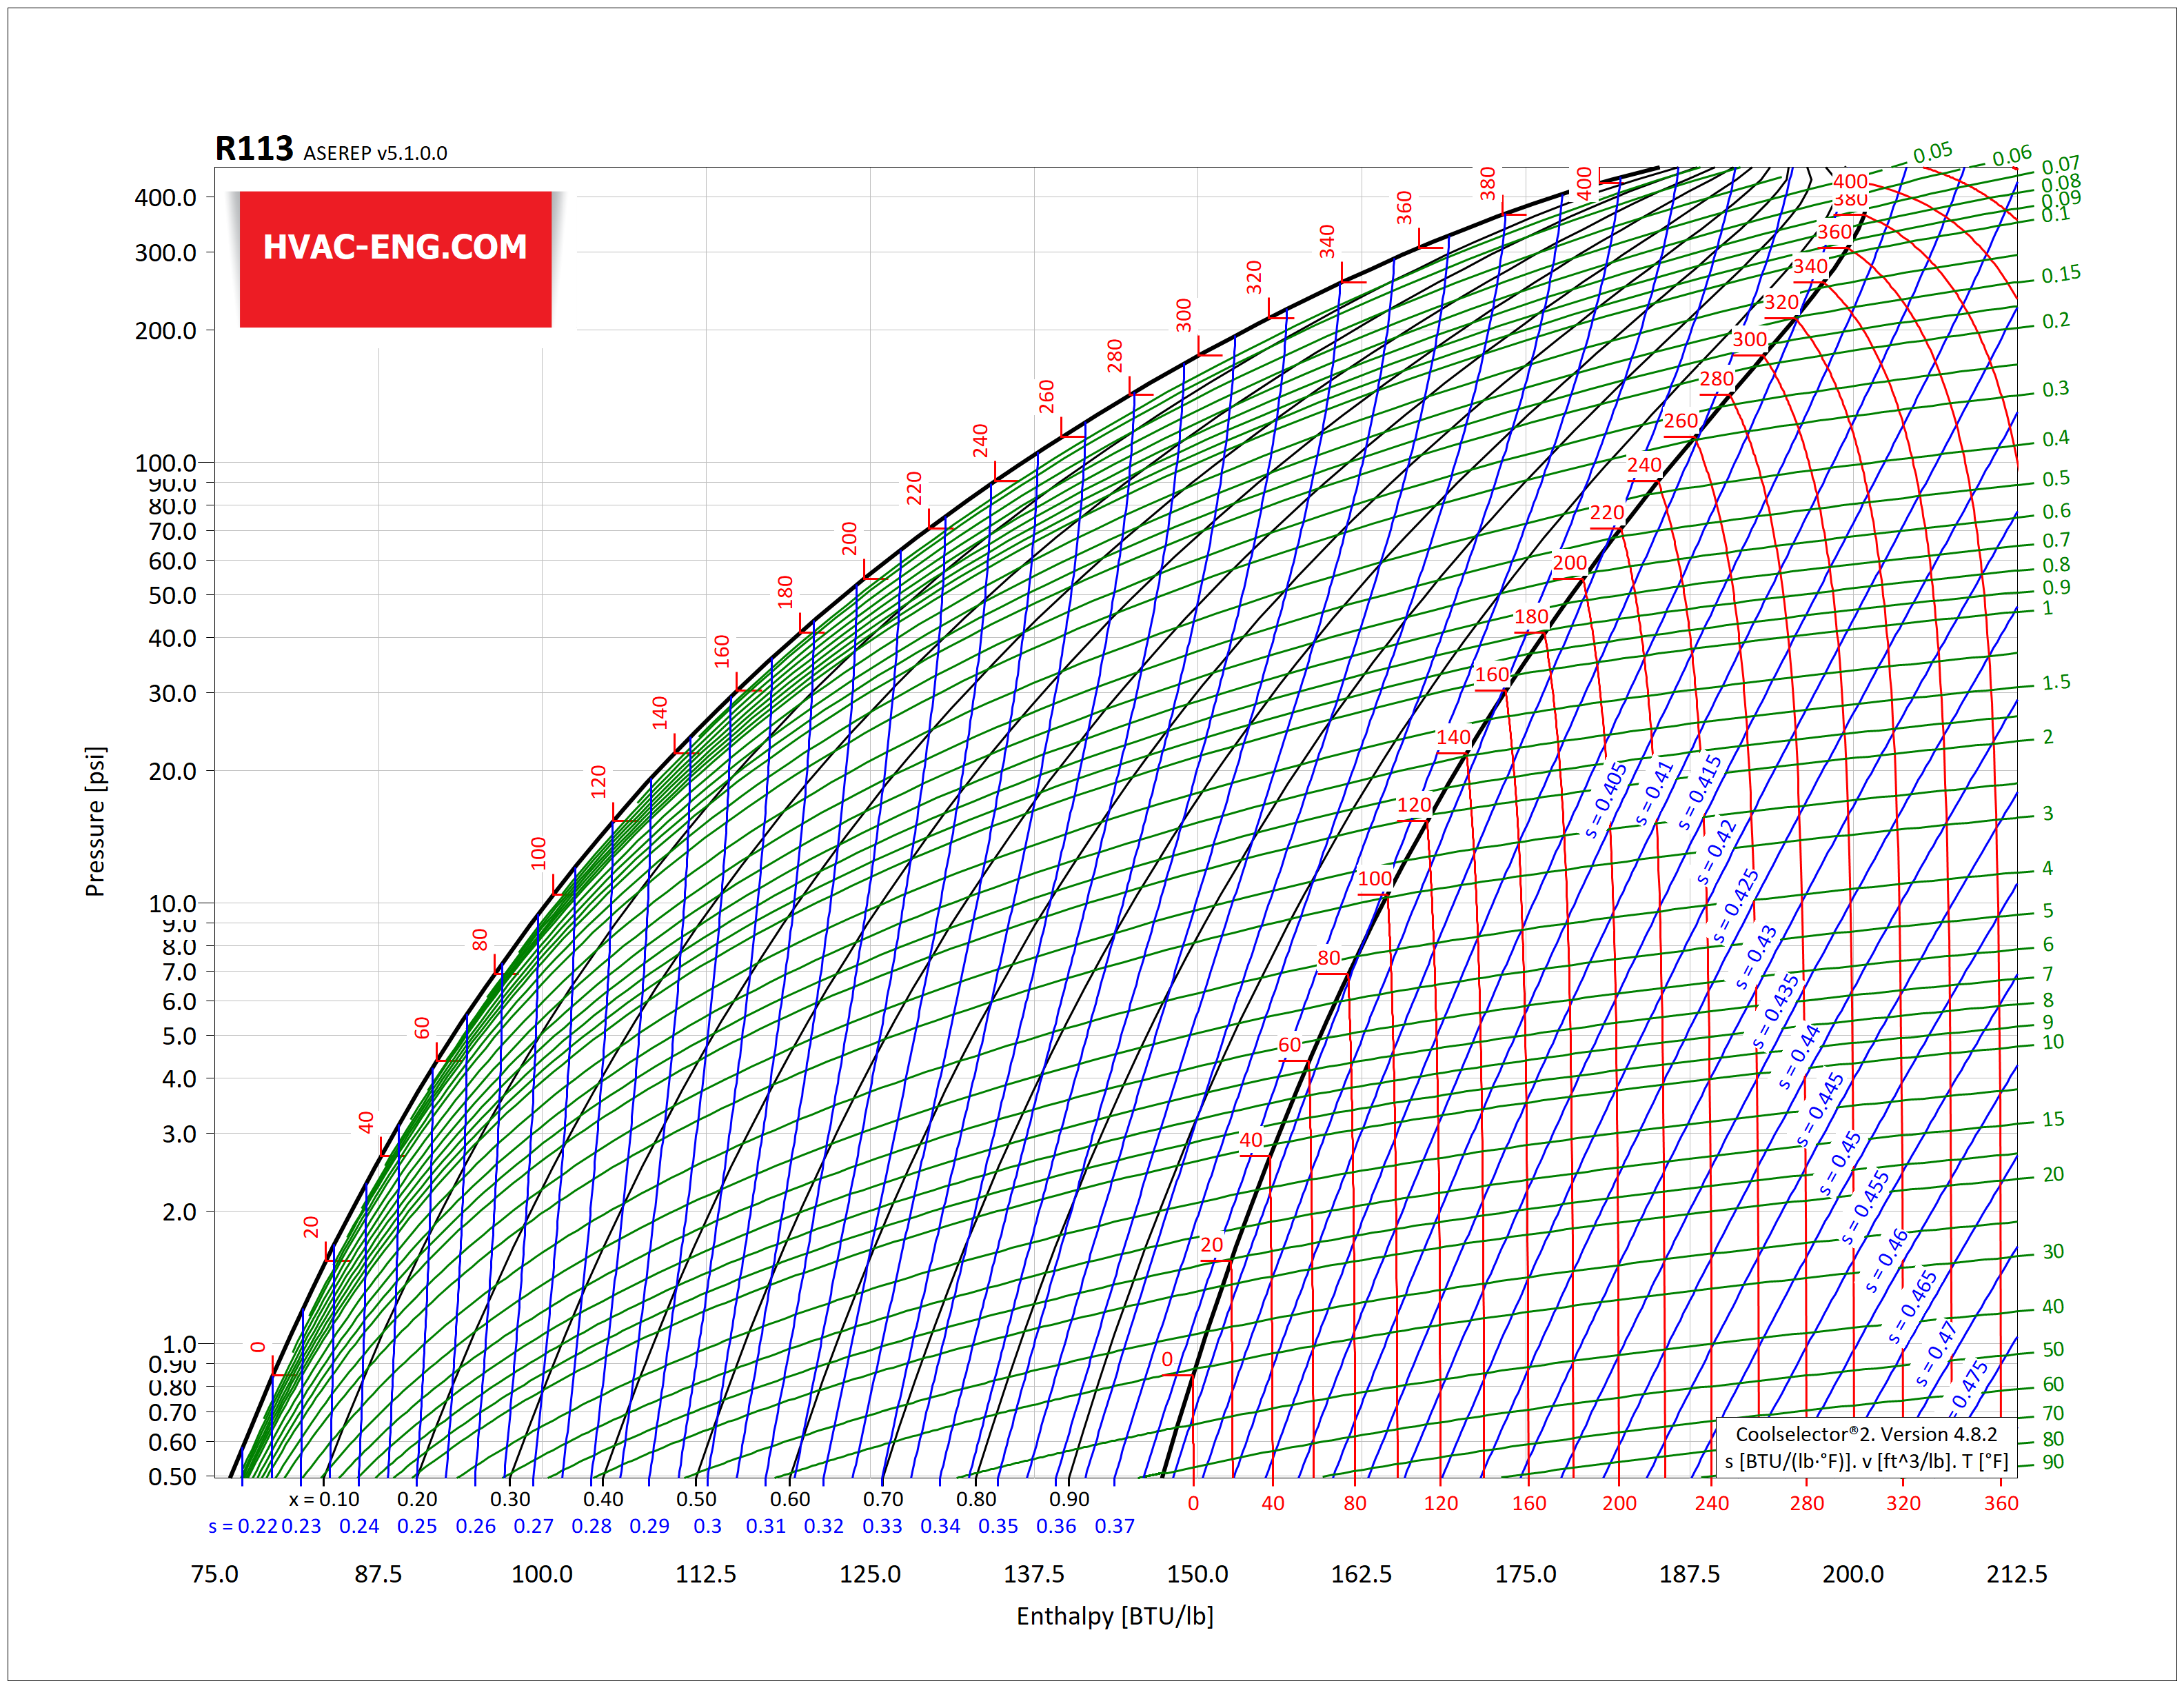
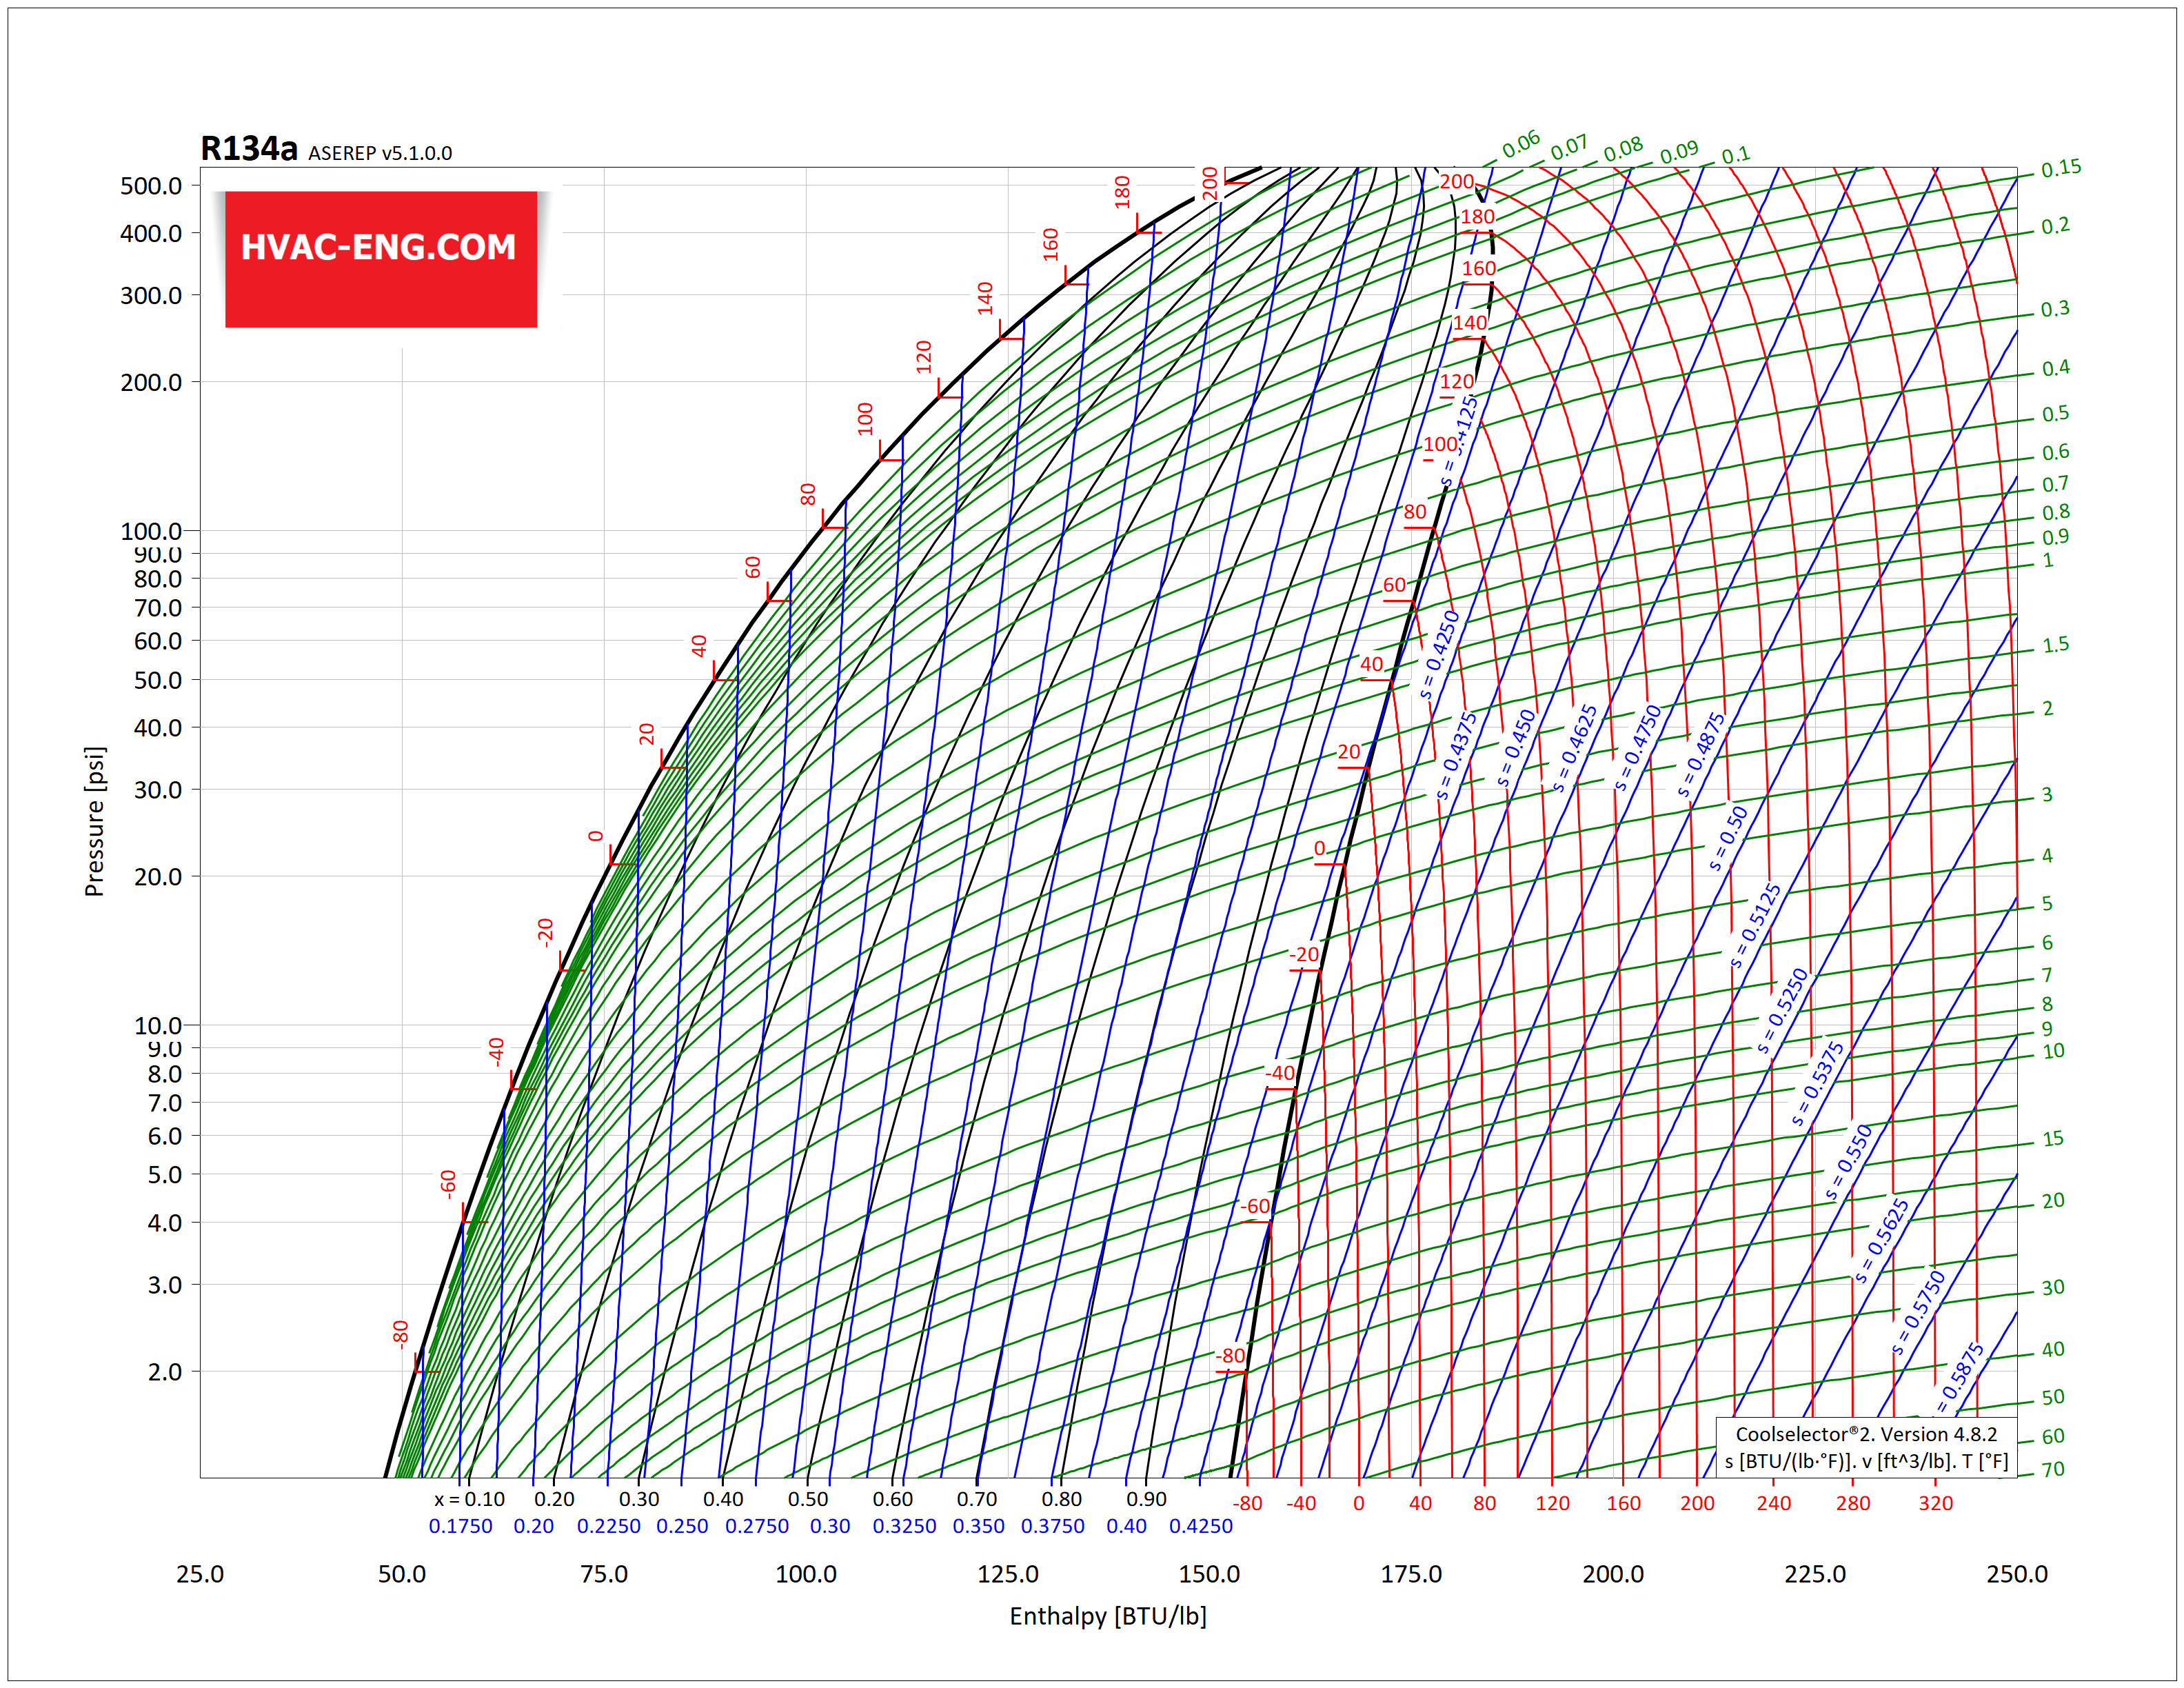
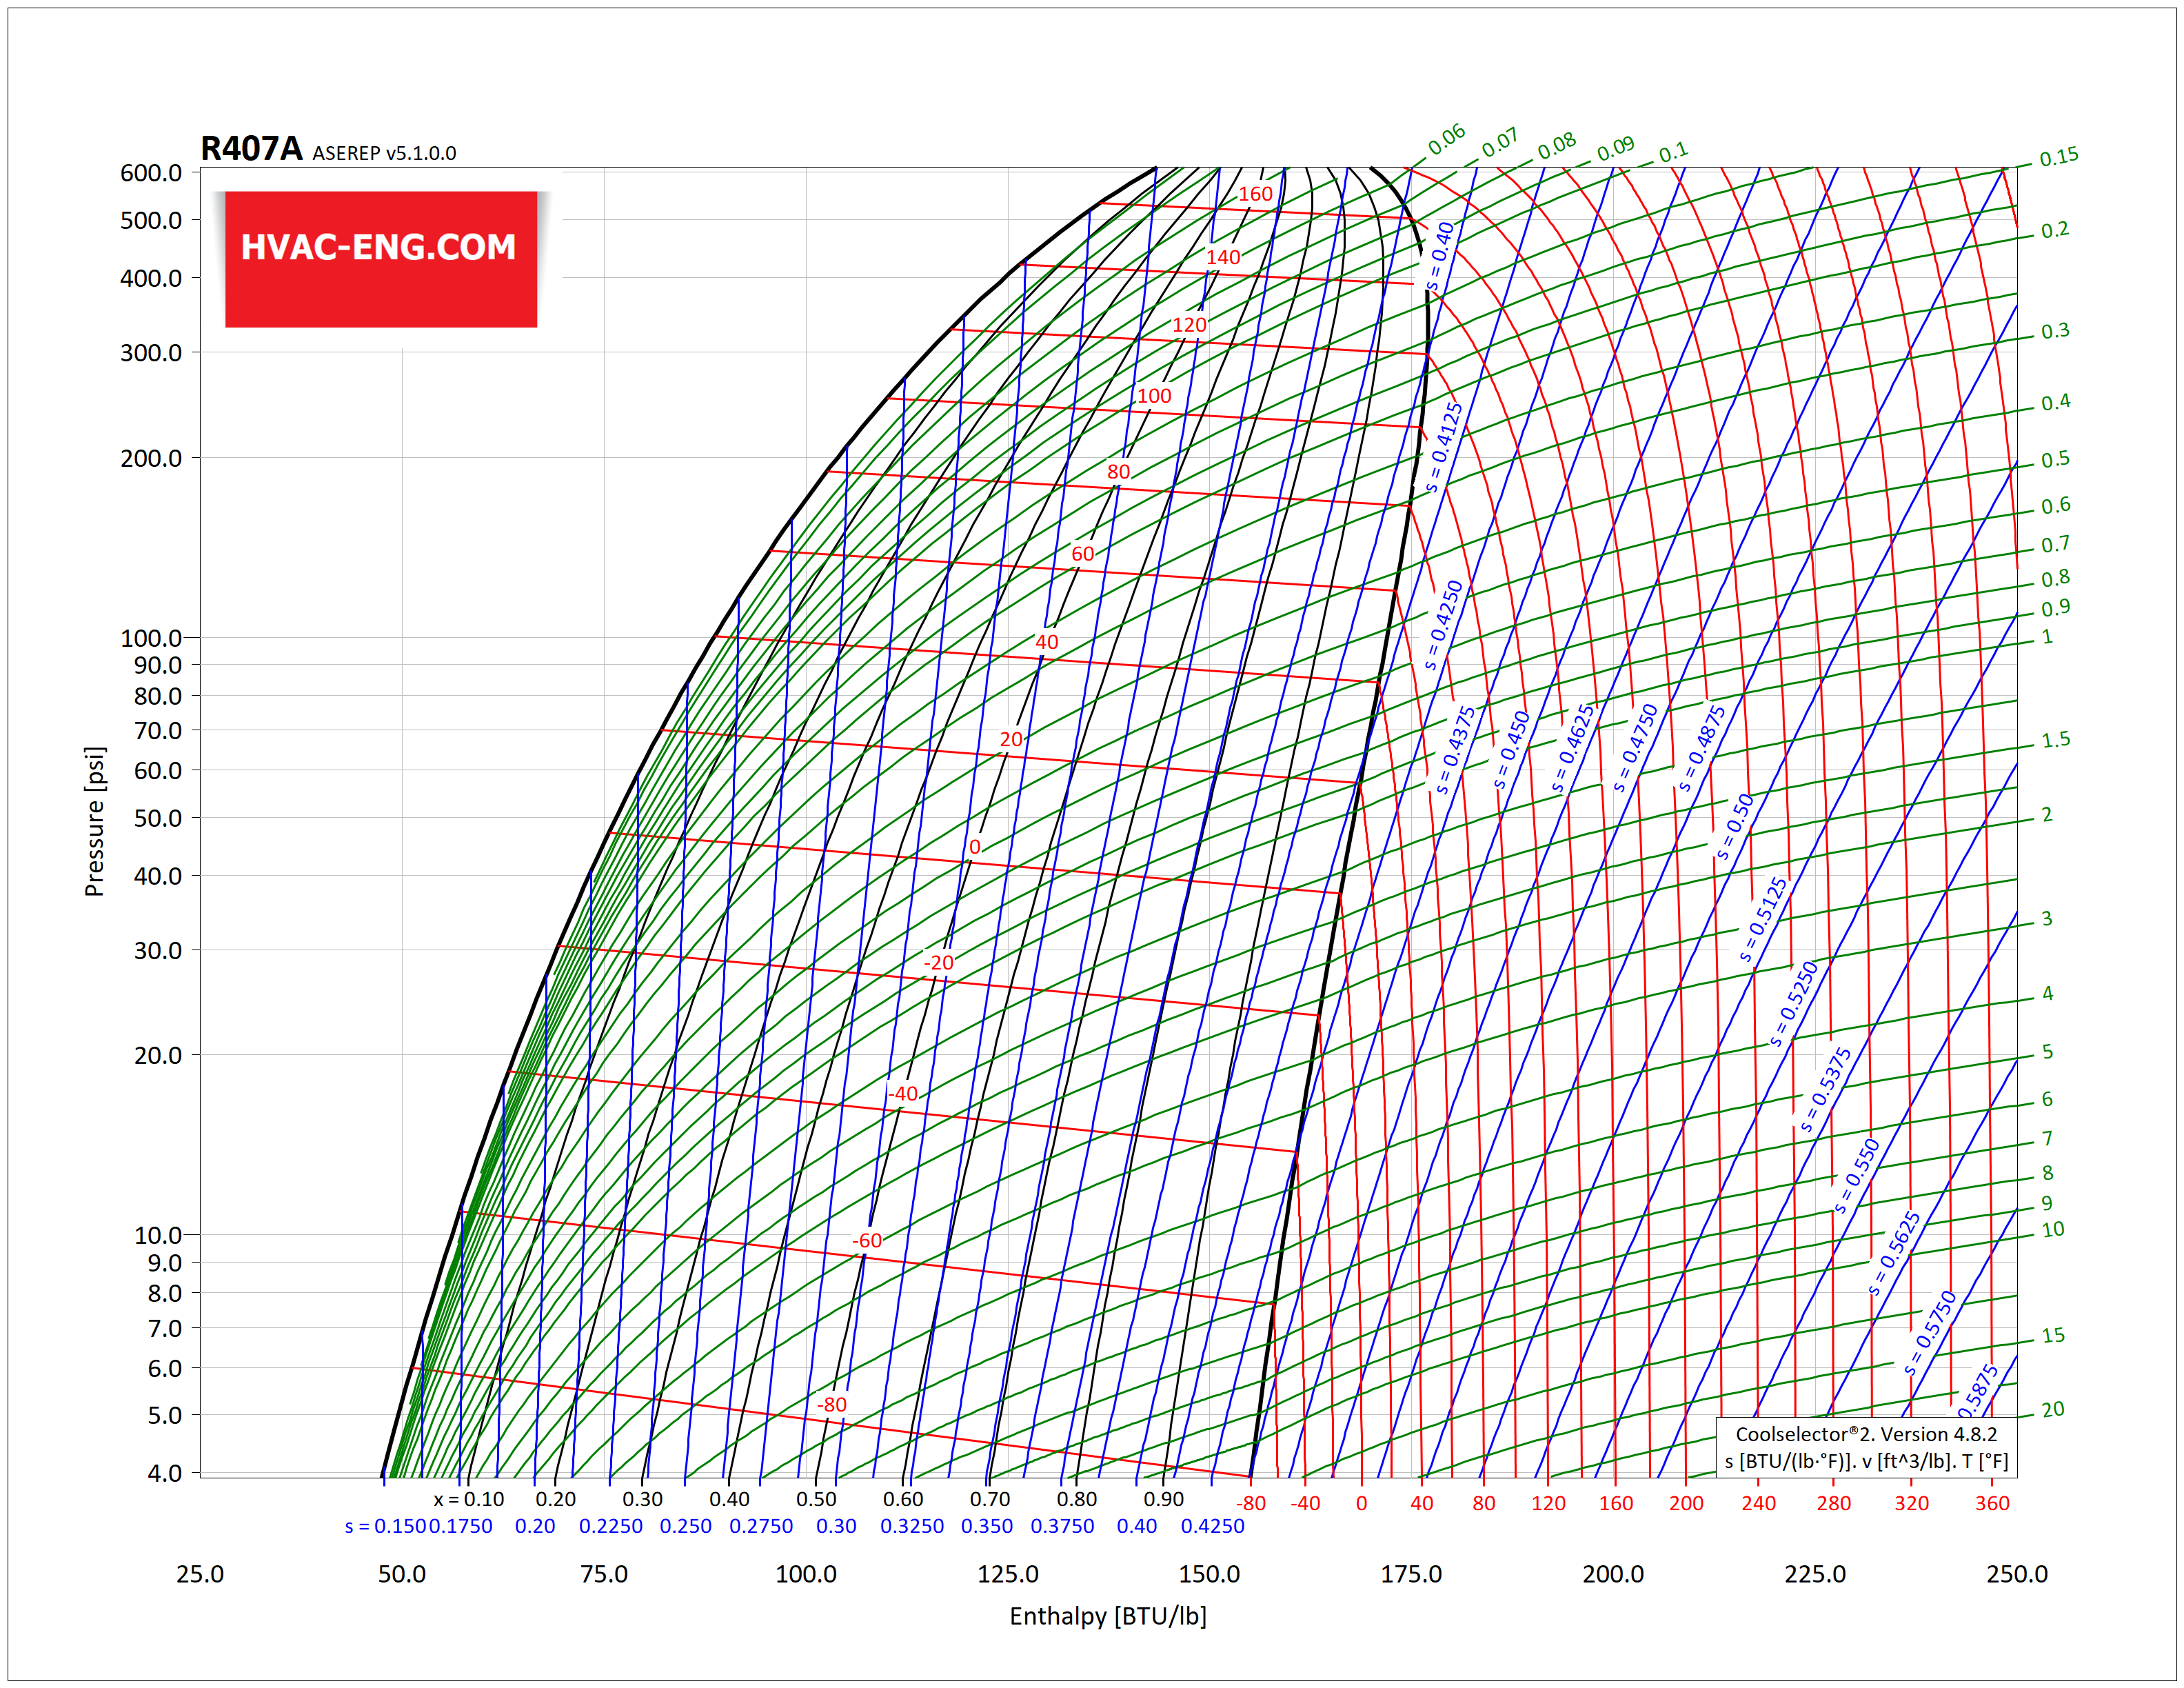
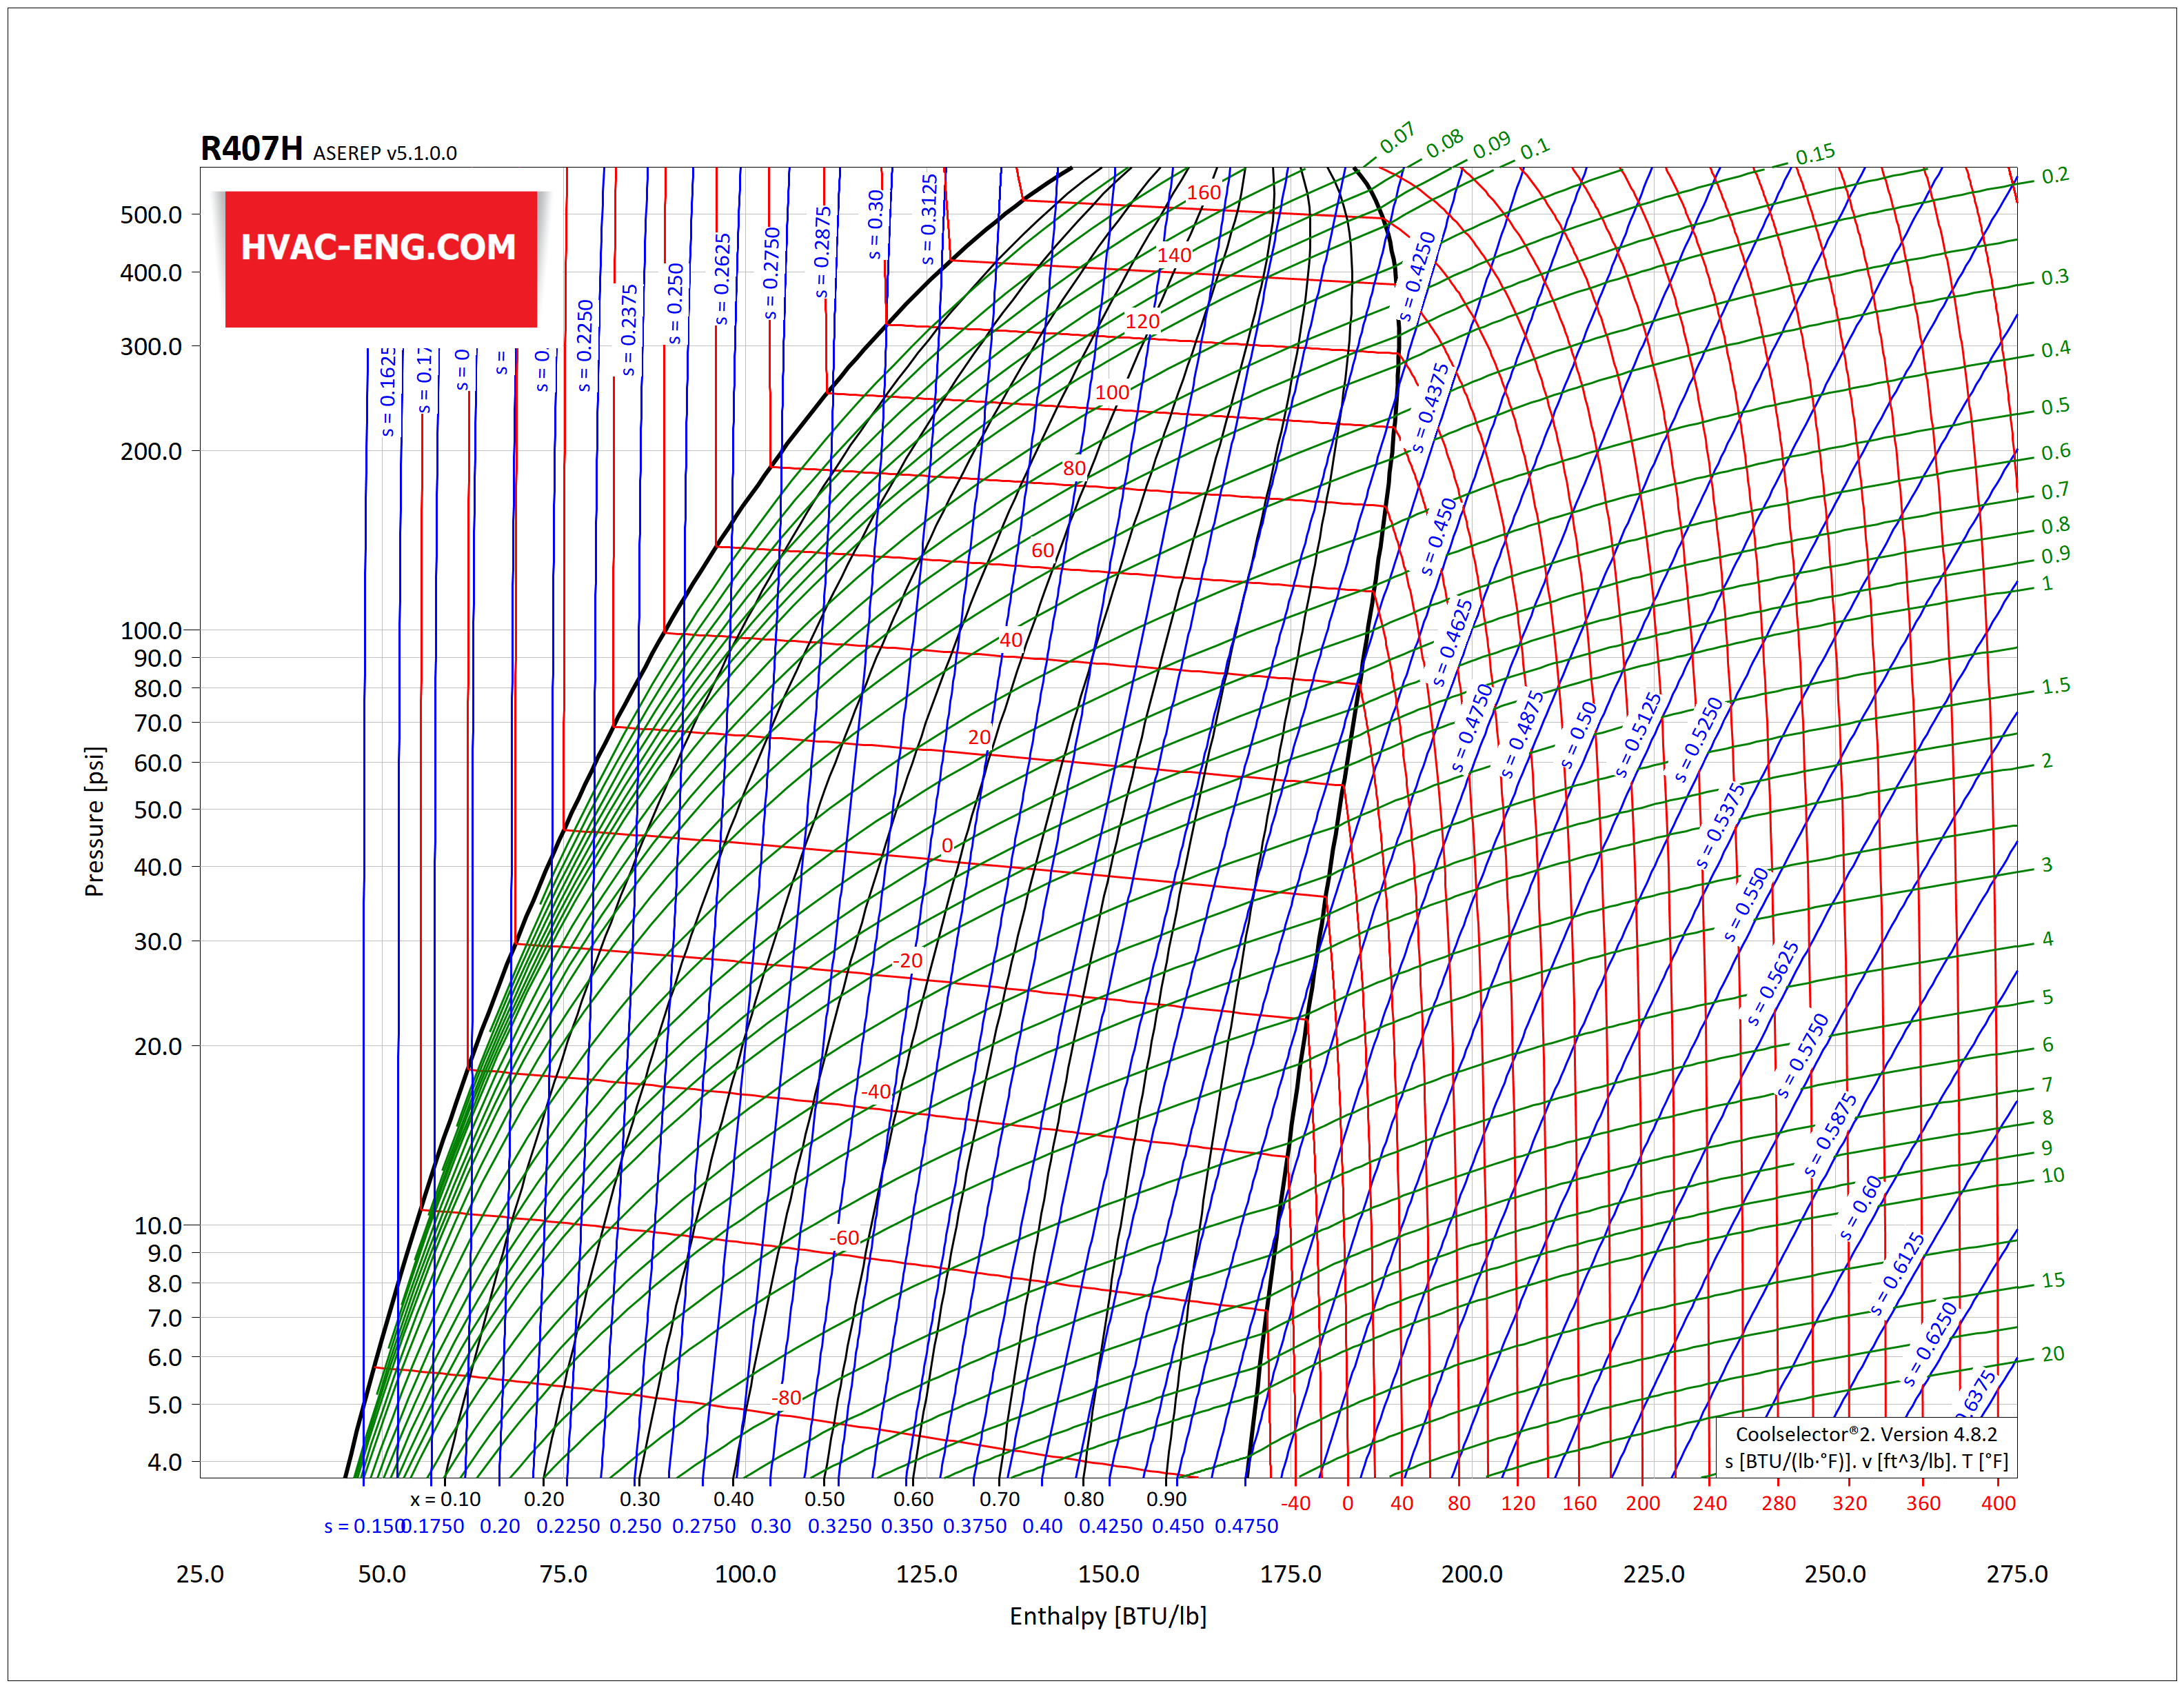
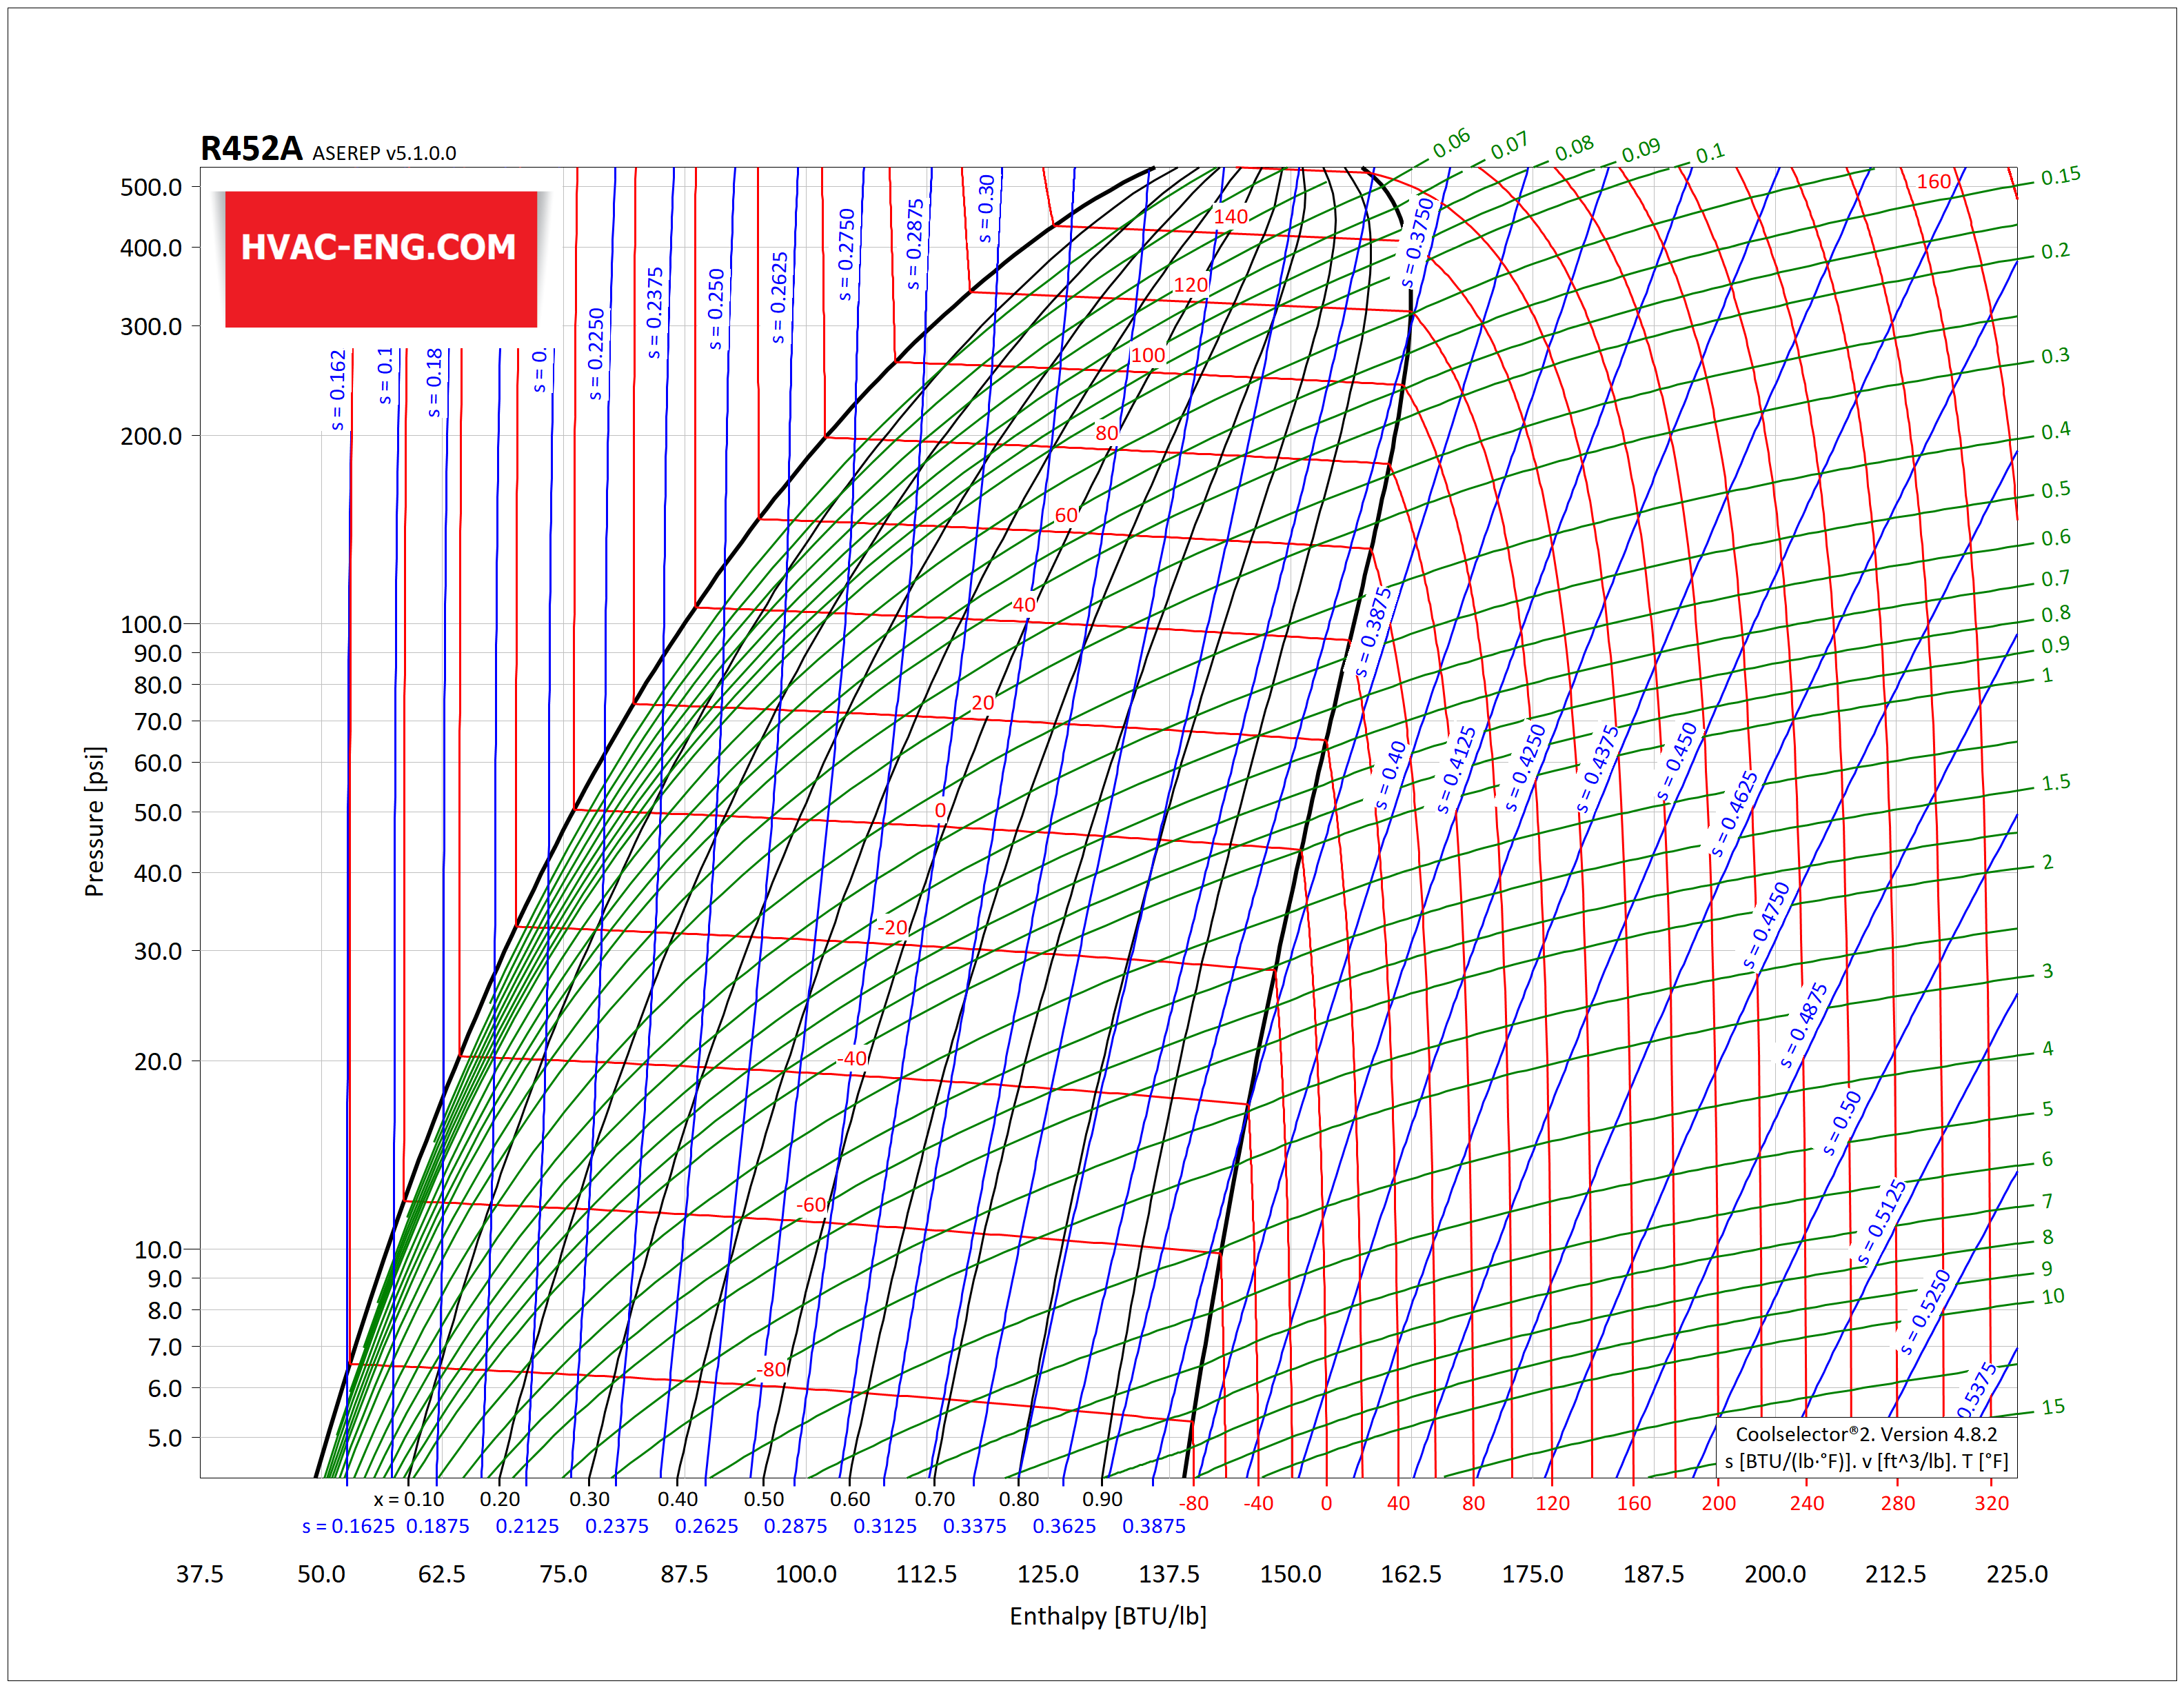
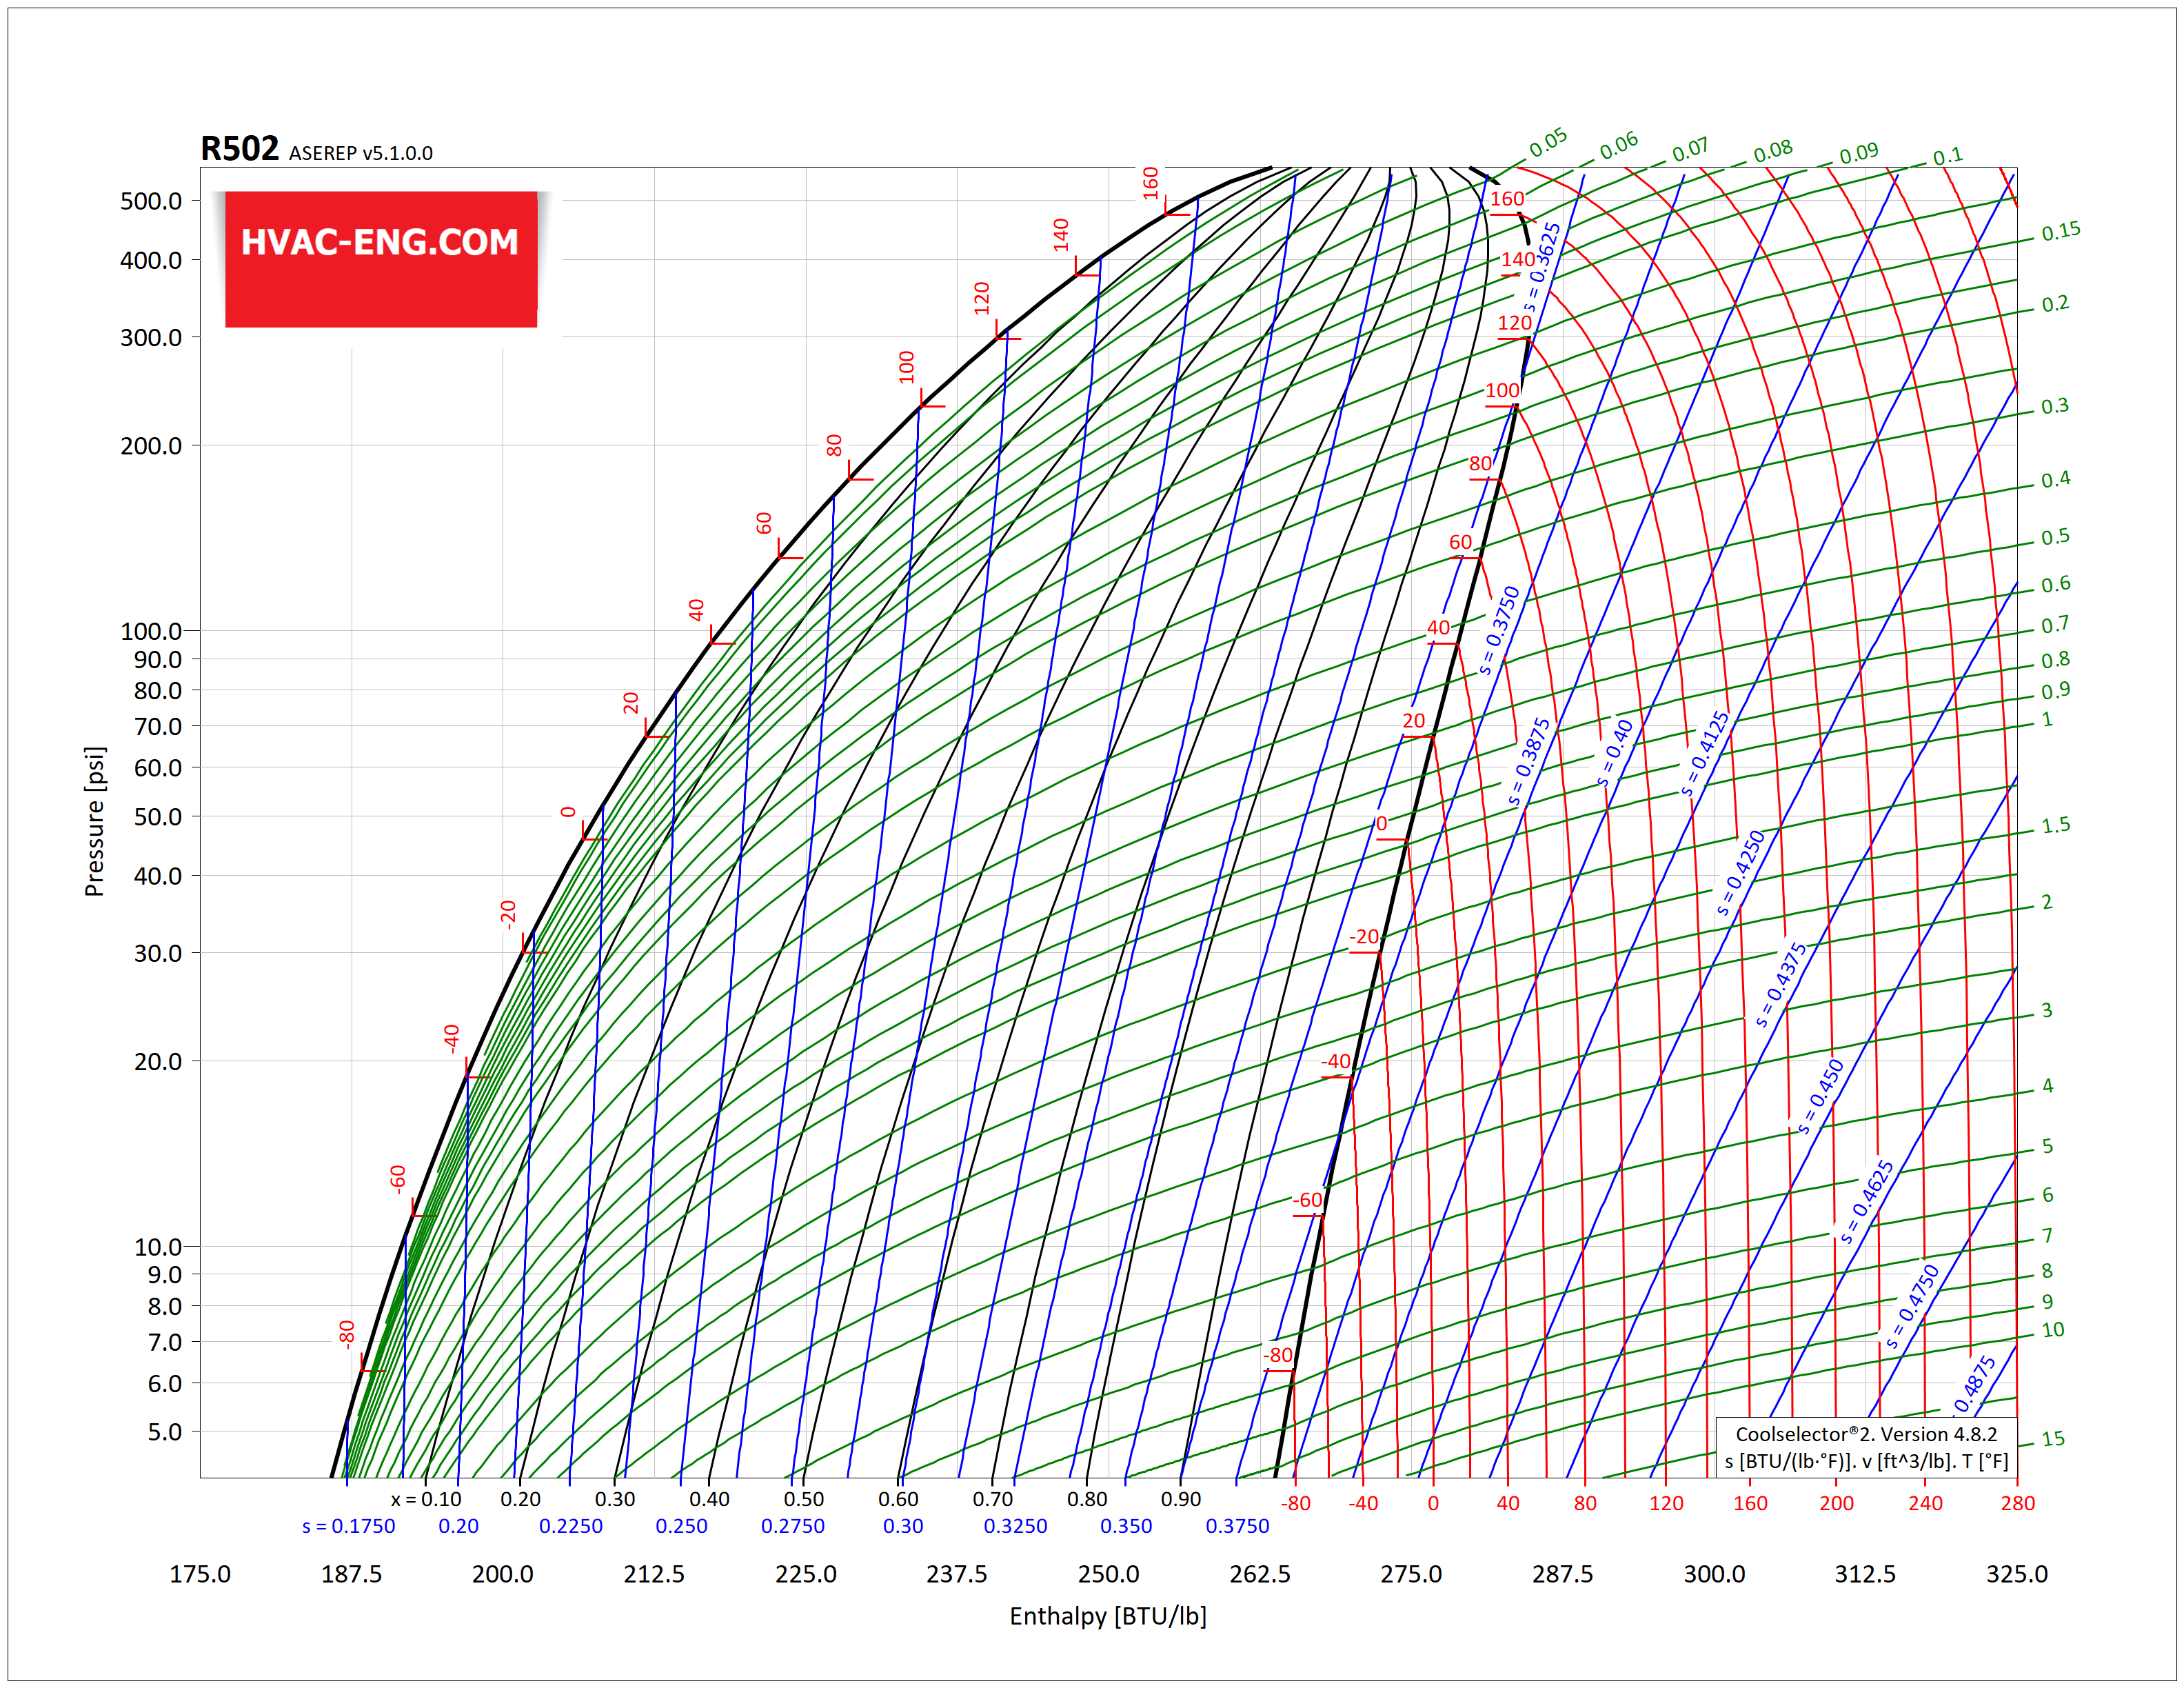
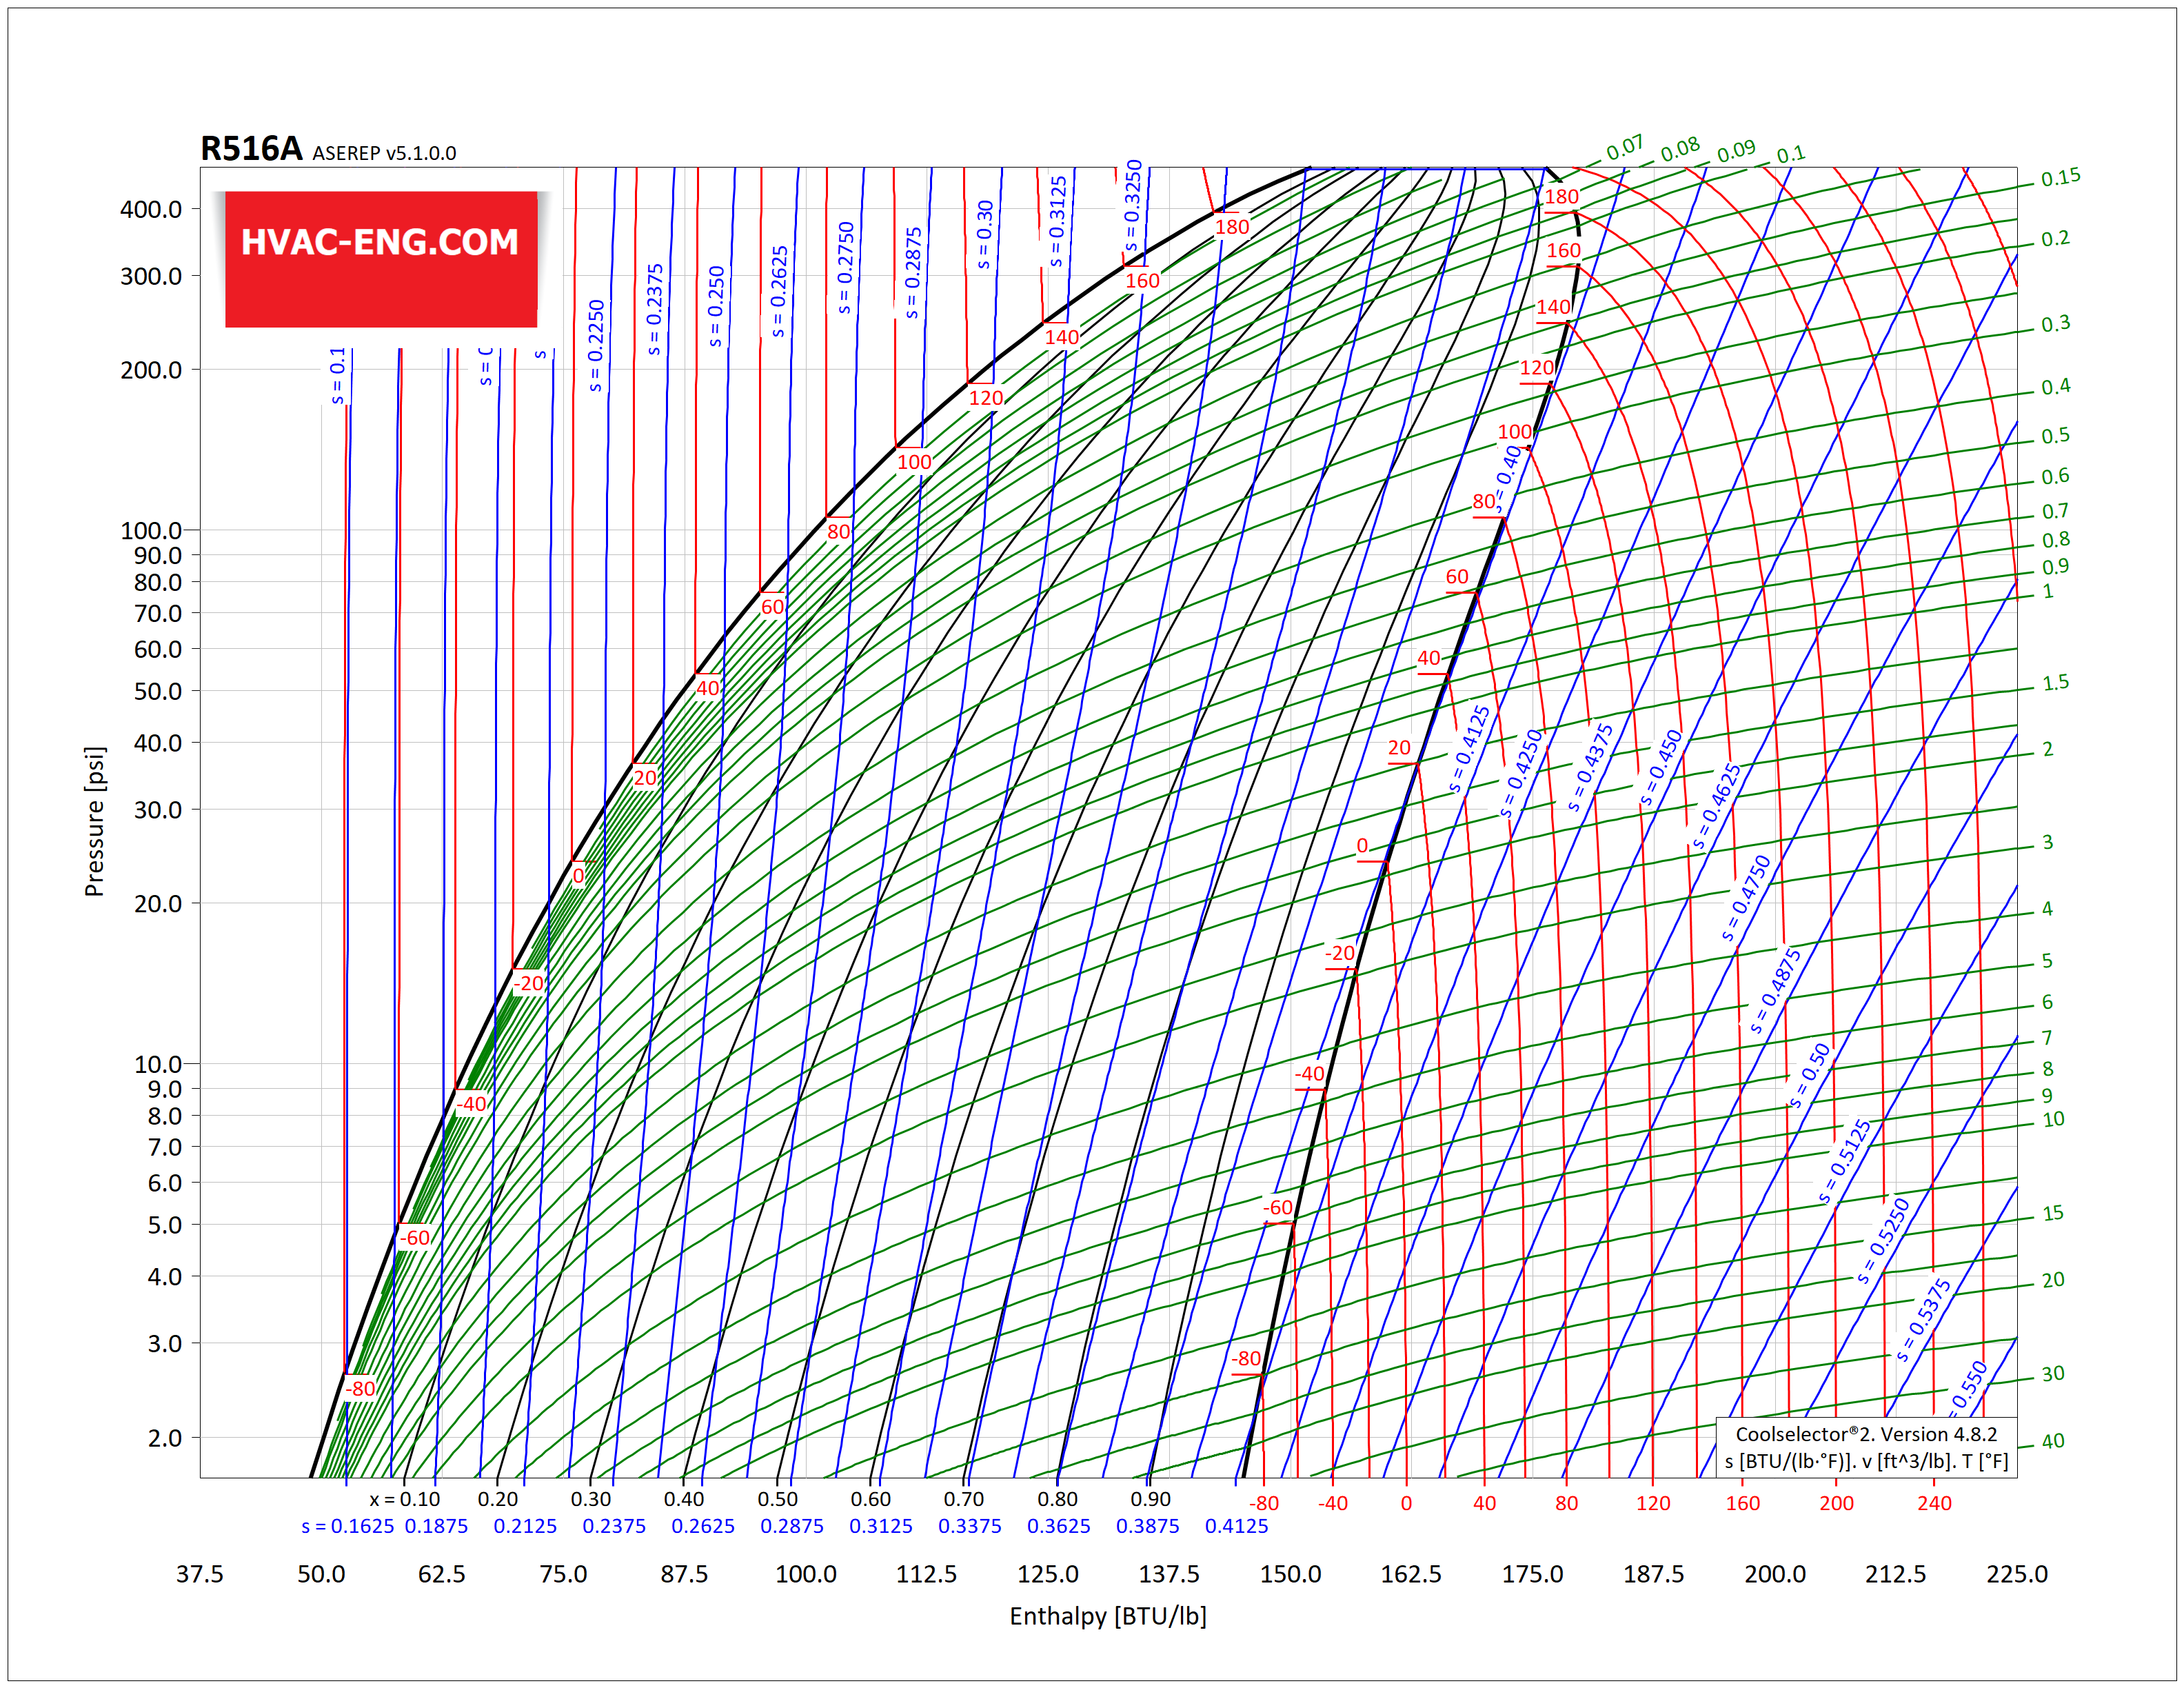
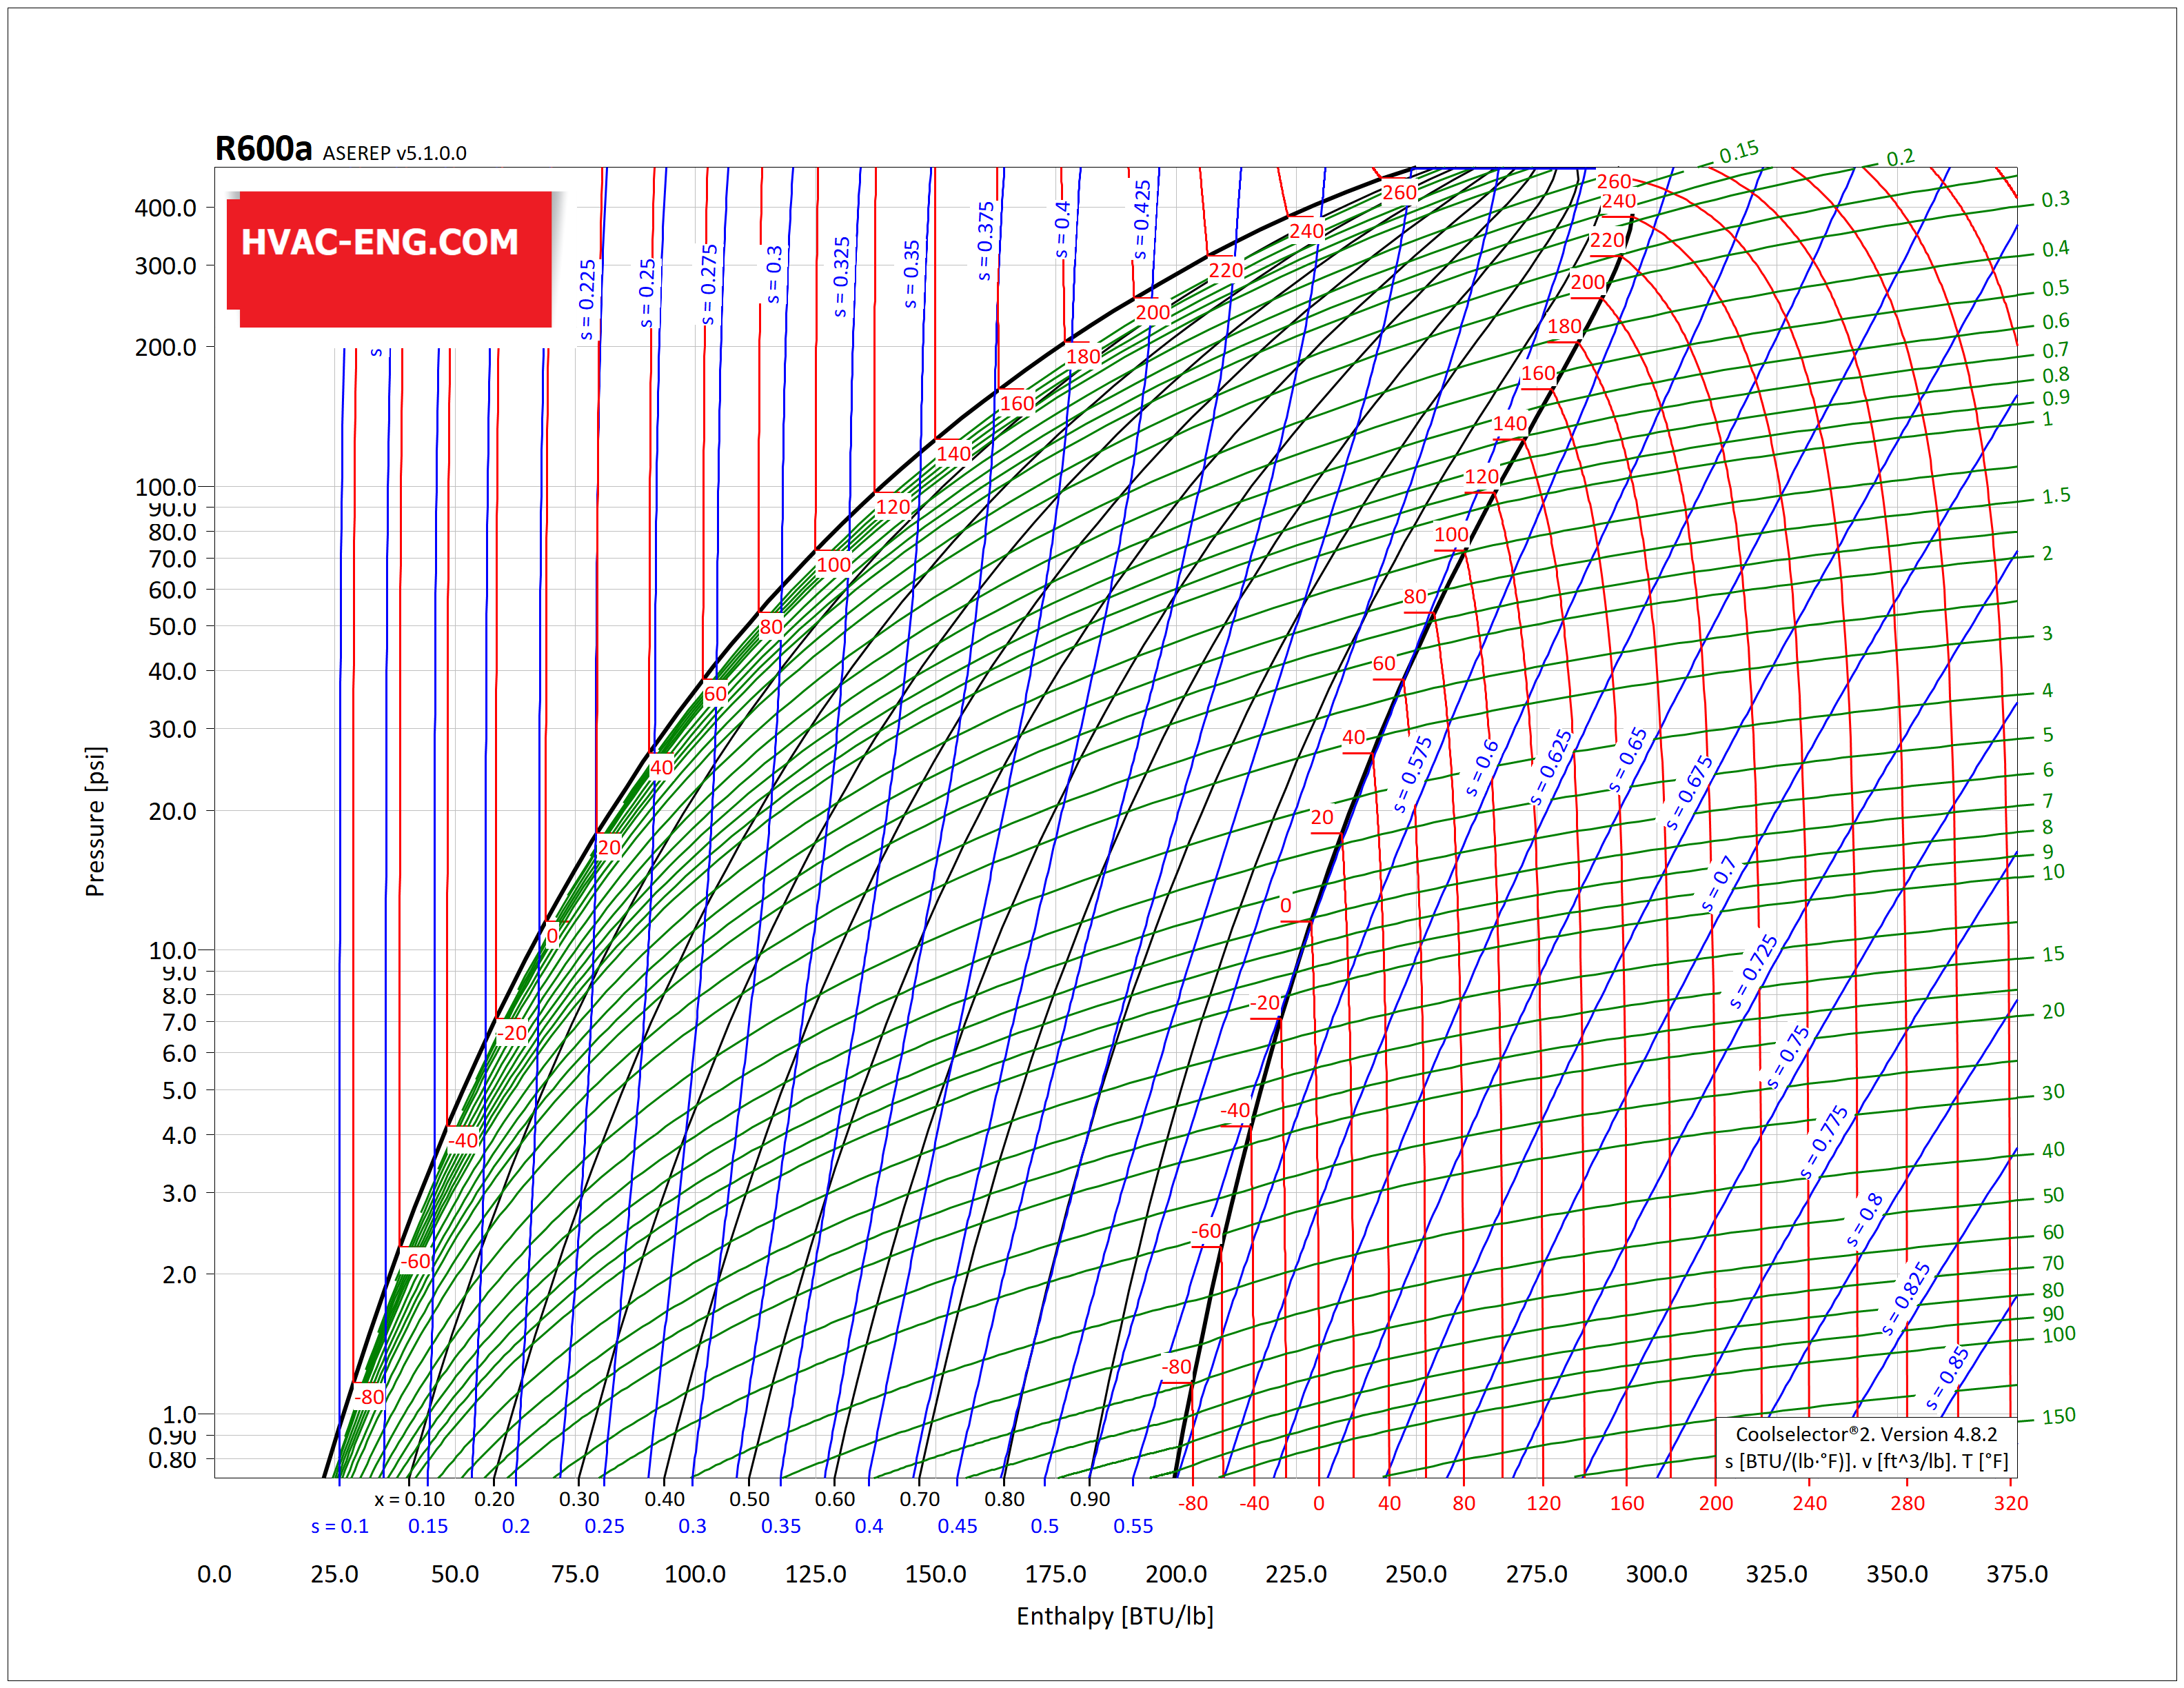
Il diagramma pressione-entalpia è lo strumento grafico più comune per l'analisi e il calcolo del trasferimento di calore e lavoro e delle prestazioni di un ciclo di refrigerazione. La variazione di pressione può essere chiaramente illustrata sul diagramma del ph. Inoltre, sia il trasferimento di calore che quello di lavoro di vari processi possono essere calcolati come variazione di entalpia e facilmente mostrati sul diagramma ph.

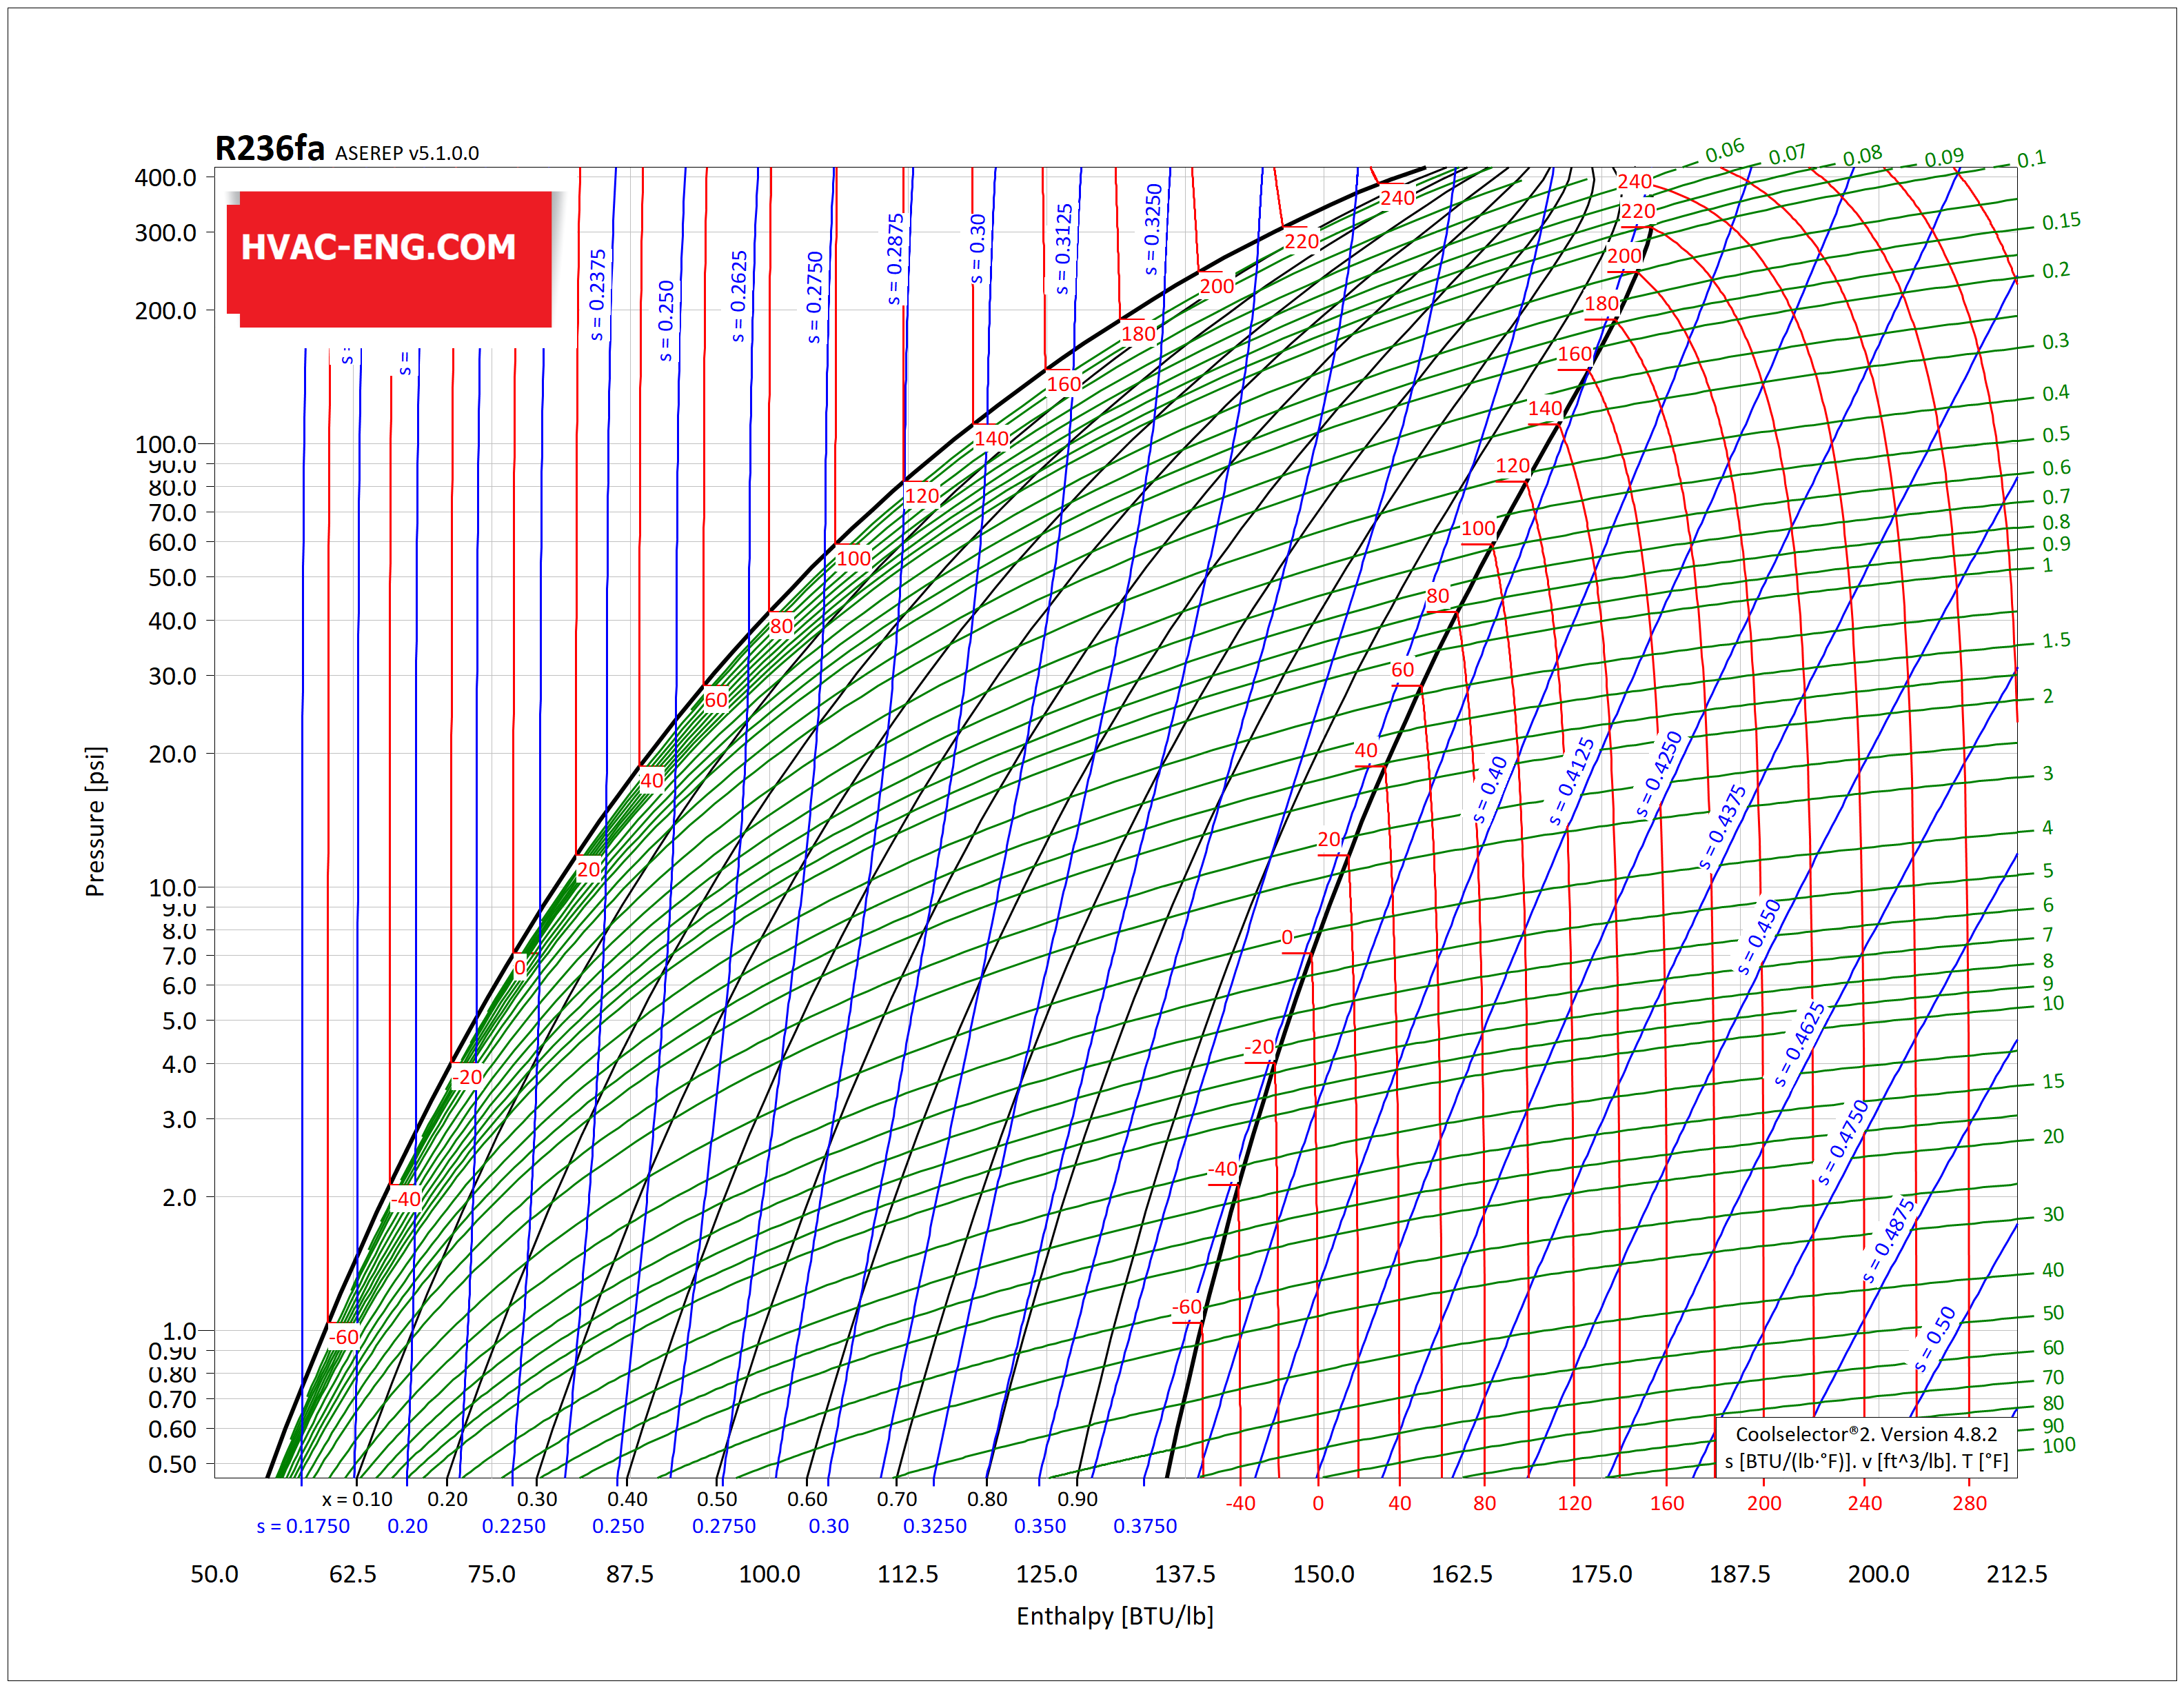
DOWNLOAD – P-h enthalpy diagram consist of following lines:
- Constant pressure lines
- Constant enthalpy lines
- Saturation line
- Isothermal lines
- Isentropic lines
- Constant volume lines
Entalpia”h" è lungo l'asse x e la pressione assoluta "p” è lungo l'asse y, entrambi espressi in scala logaritmica. IL linea del liquido saturo separa il liquido sottoraffreddato dalla regione bifase in cui coesistono vapore e refrigeranti liquidi. IL linea del vapore saturo separa questa regione bifase dal vapore surriscaldato. Nella regione a due fasi, la linea di qualità della frazione di secchezza costante suddivide la miscela di vapore e liquido. IL temperatura costante le linee sono quasi verticali nella regione del liquido sottoraffreddato. A temperature più elevate, sono curve vicino alla linea del liquido saturo. Nella regione a due fasi, le linee a temperatura costante sono orizzontali. Anche nella regione surriscaldata, il entropia costante le linee inclinano bruscamente verso l'alto e le linee a volume costante sono più piatte. Entrambi sono leggermente curvi.
Questo articolo è una continuazione del nostro più vecchio articolo, che è stato ben accolto dagli utenti, quindi abbiamo deciso di aggiornare l'elenco dei diagrammi PH e fornirvi un elenco più completo dei refrigeranti commerciali del mondo. È possibile accedere facilmente alla tabella dei refrigeranti di alta qualità facendo clic sui refrigeranti elencati nella tabella.


_PH_Diagram.png)
_PH_Diagram.png)
_PH_Diagram.png)
_PH_Diagram.png)
_PH_Diagram.png)
_PH_Diagram.png)
_PH_Diagram.png)
_PH_Diagram.png)