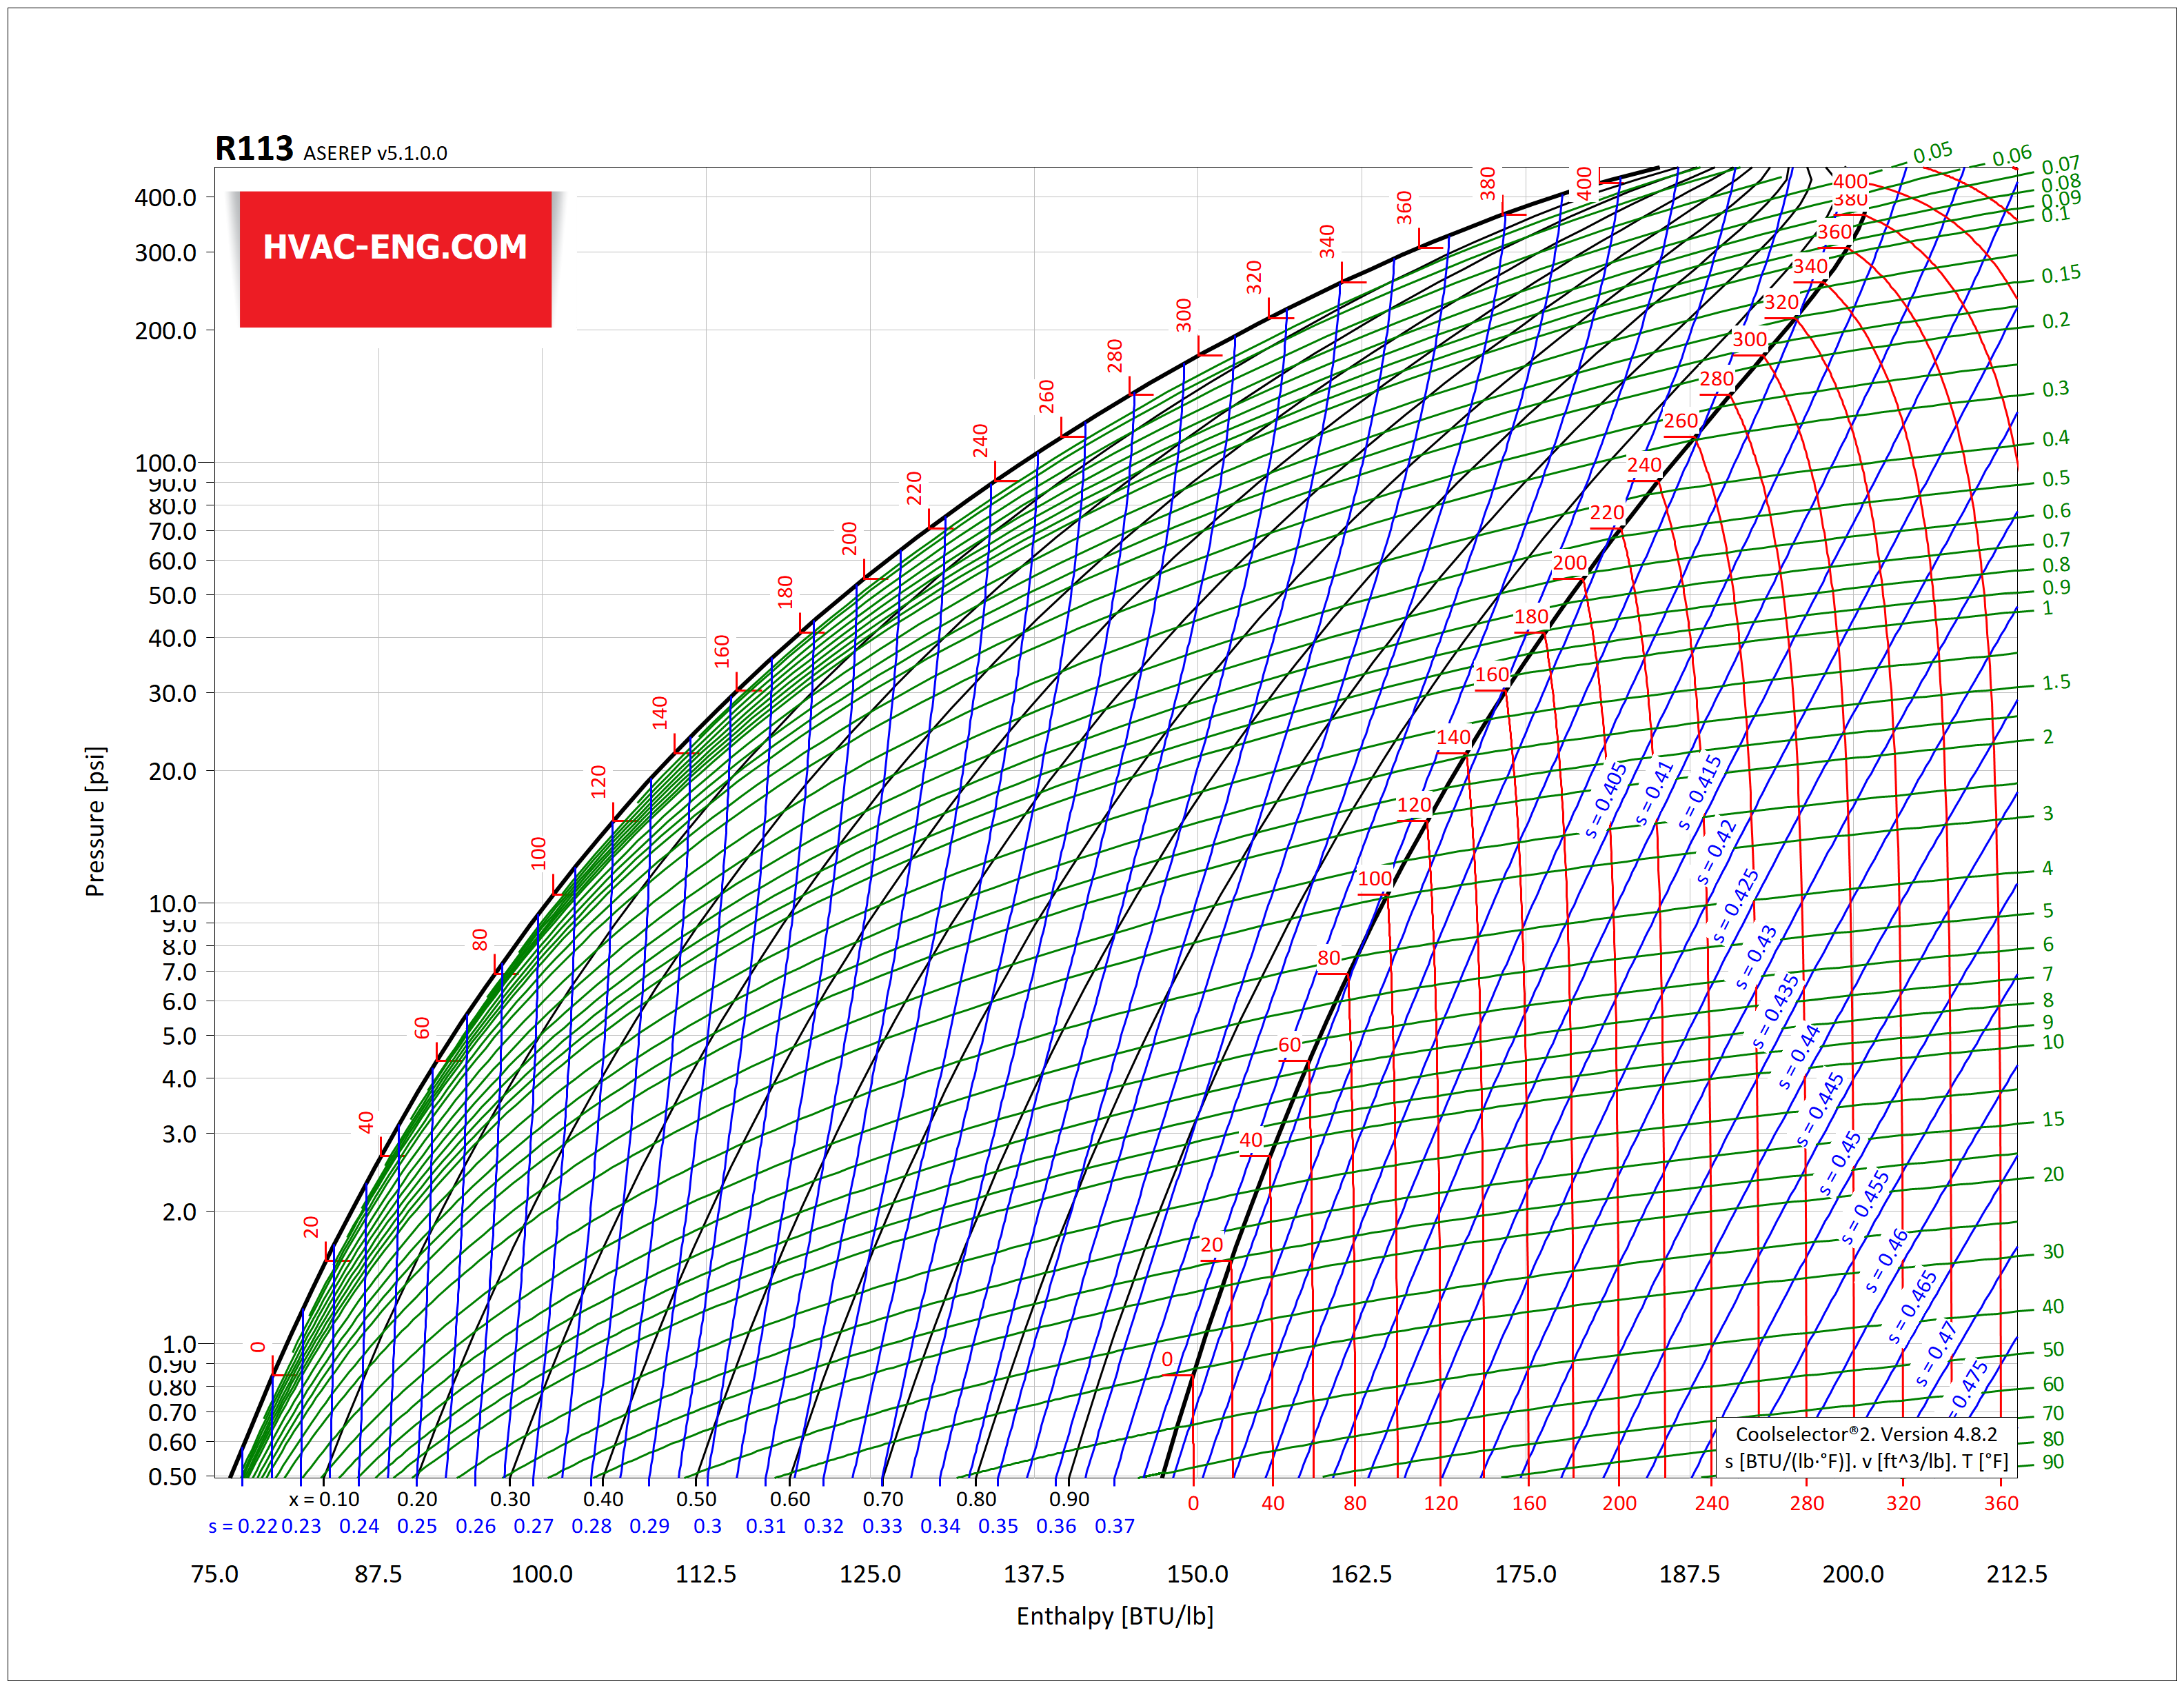
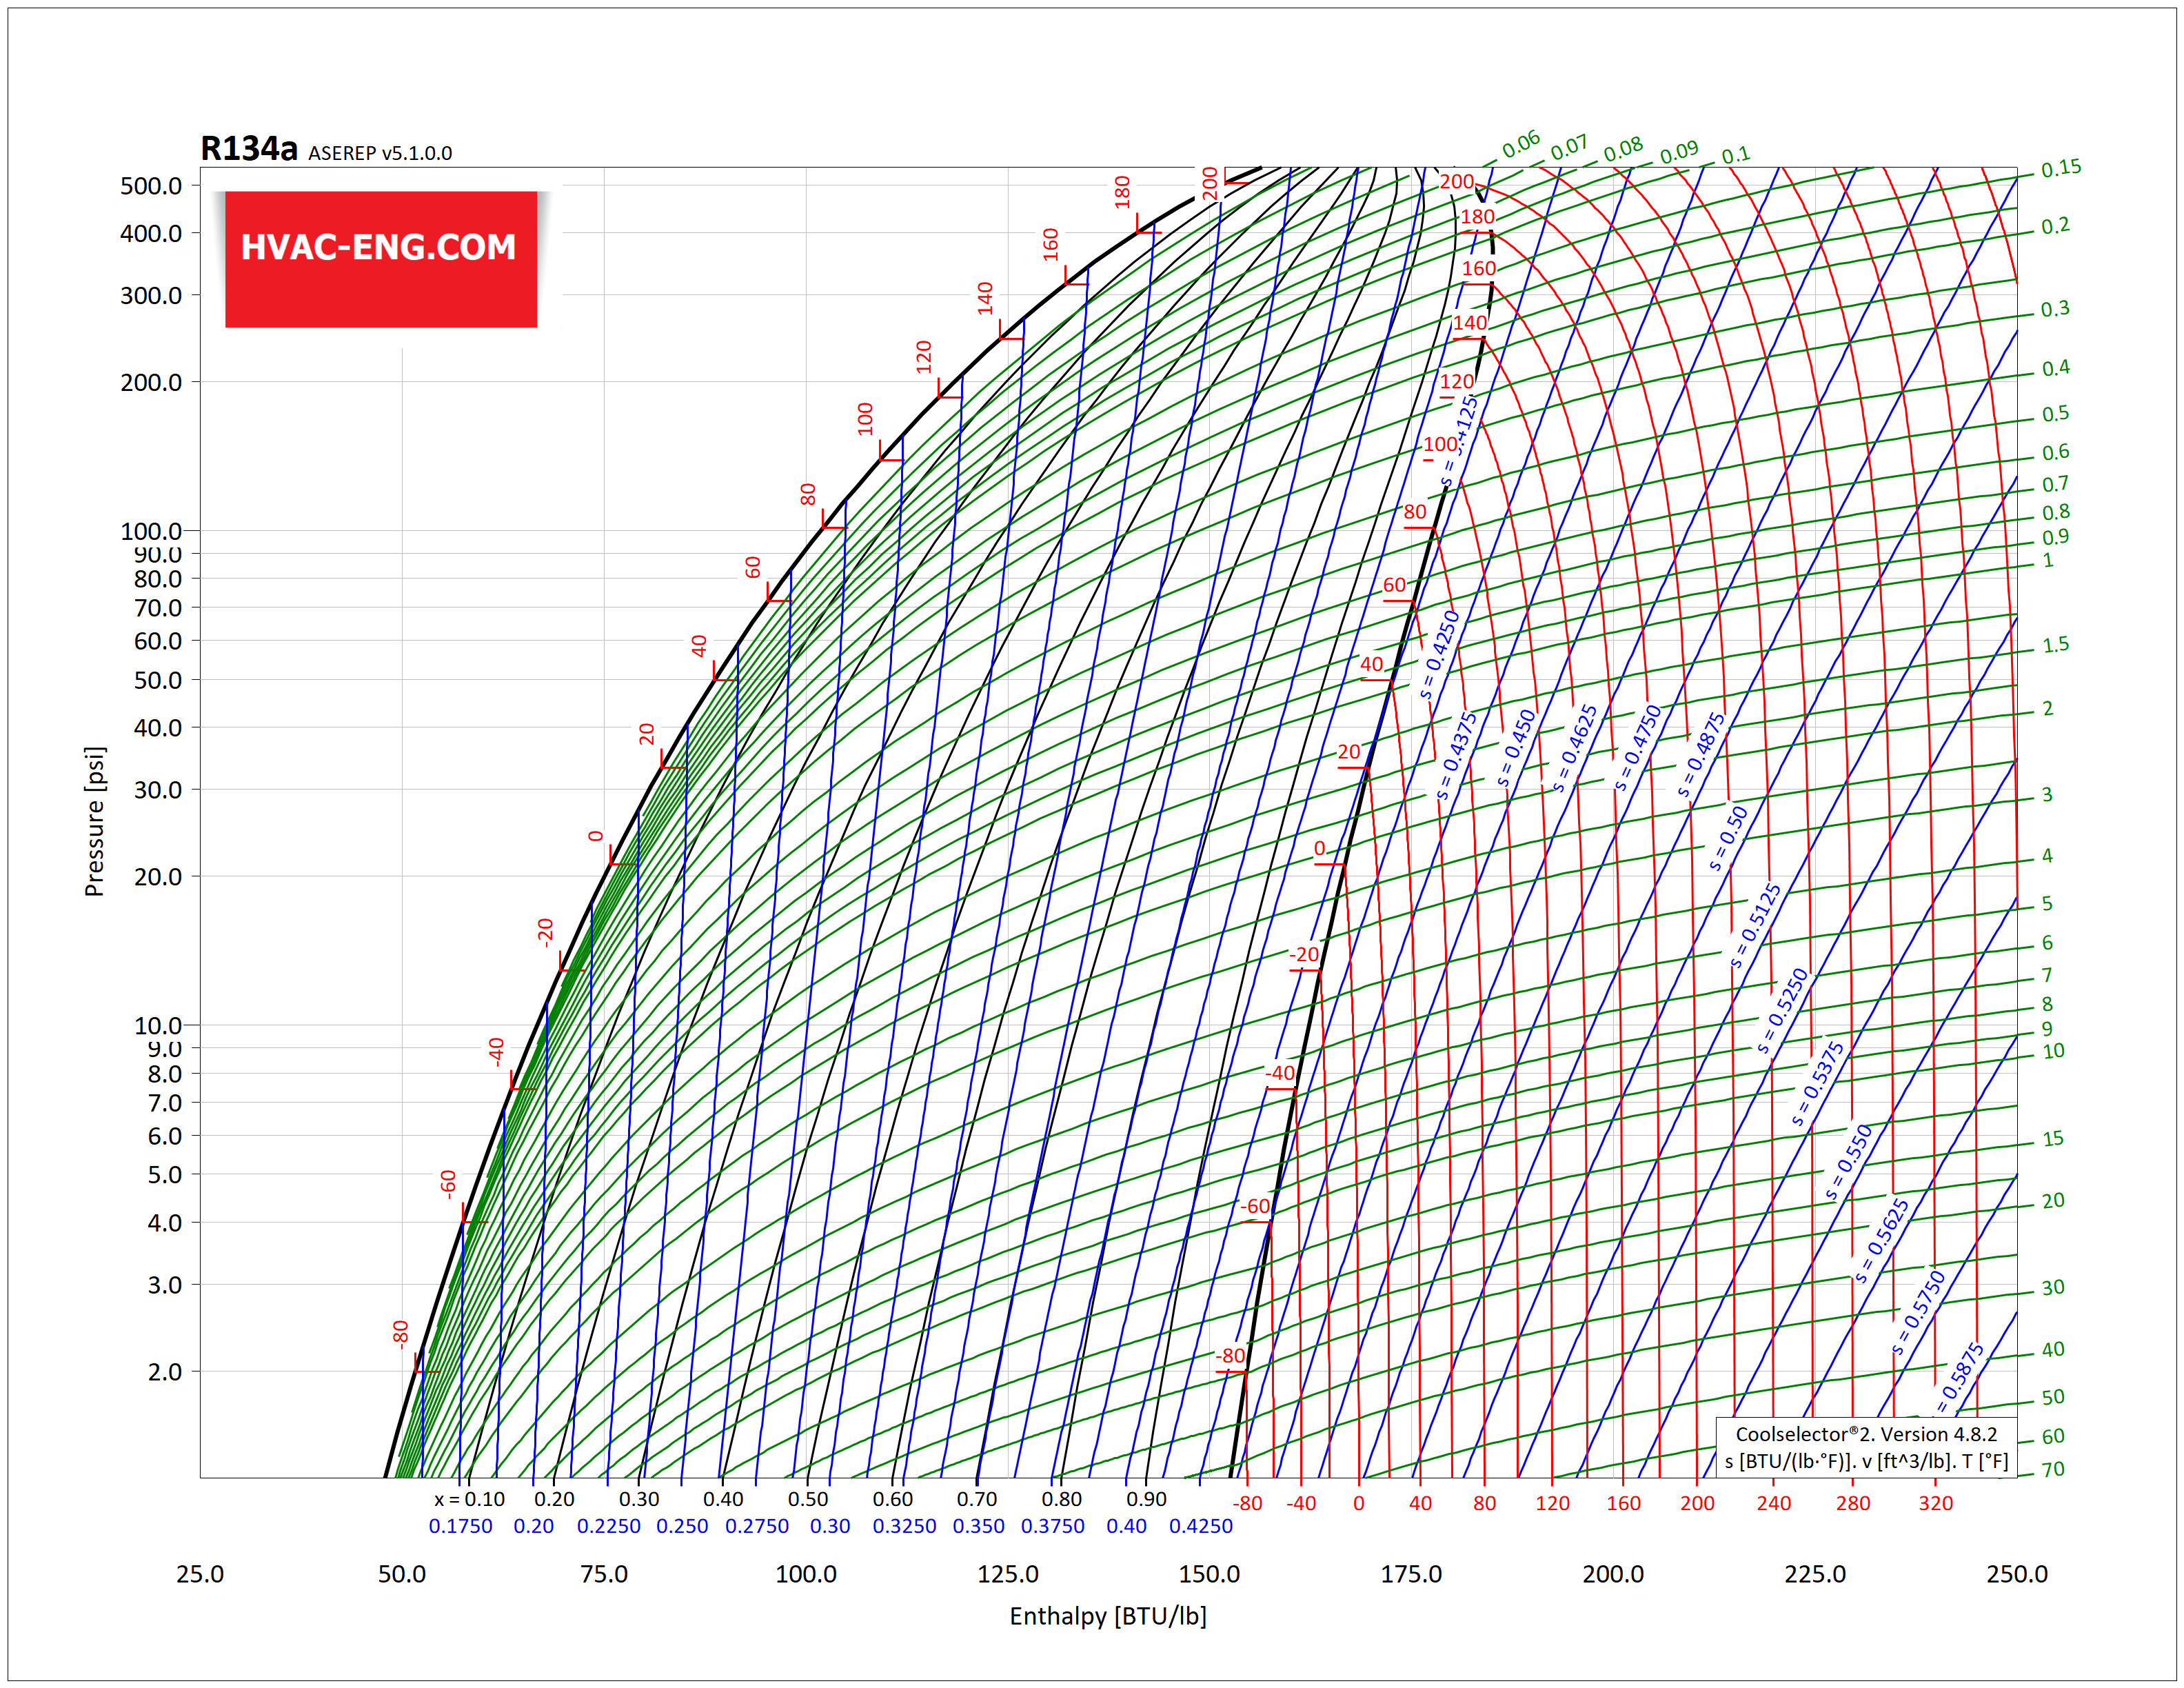
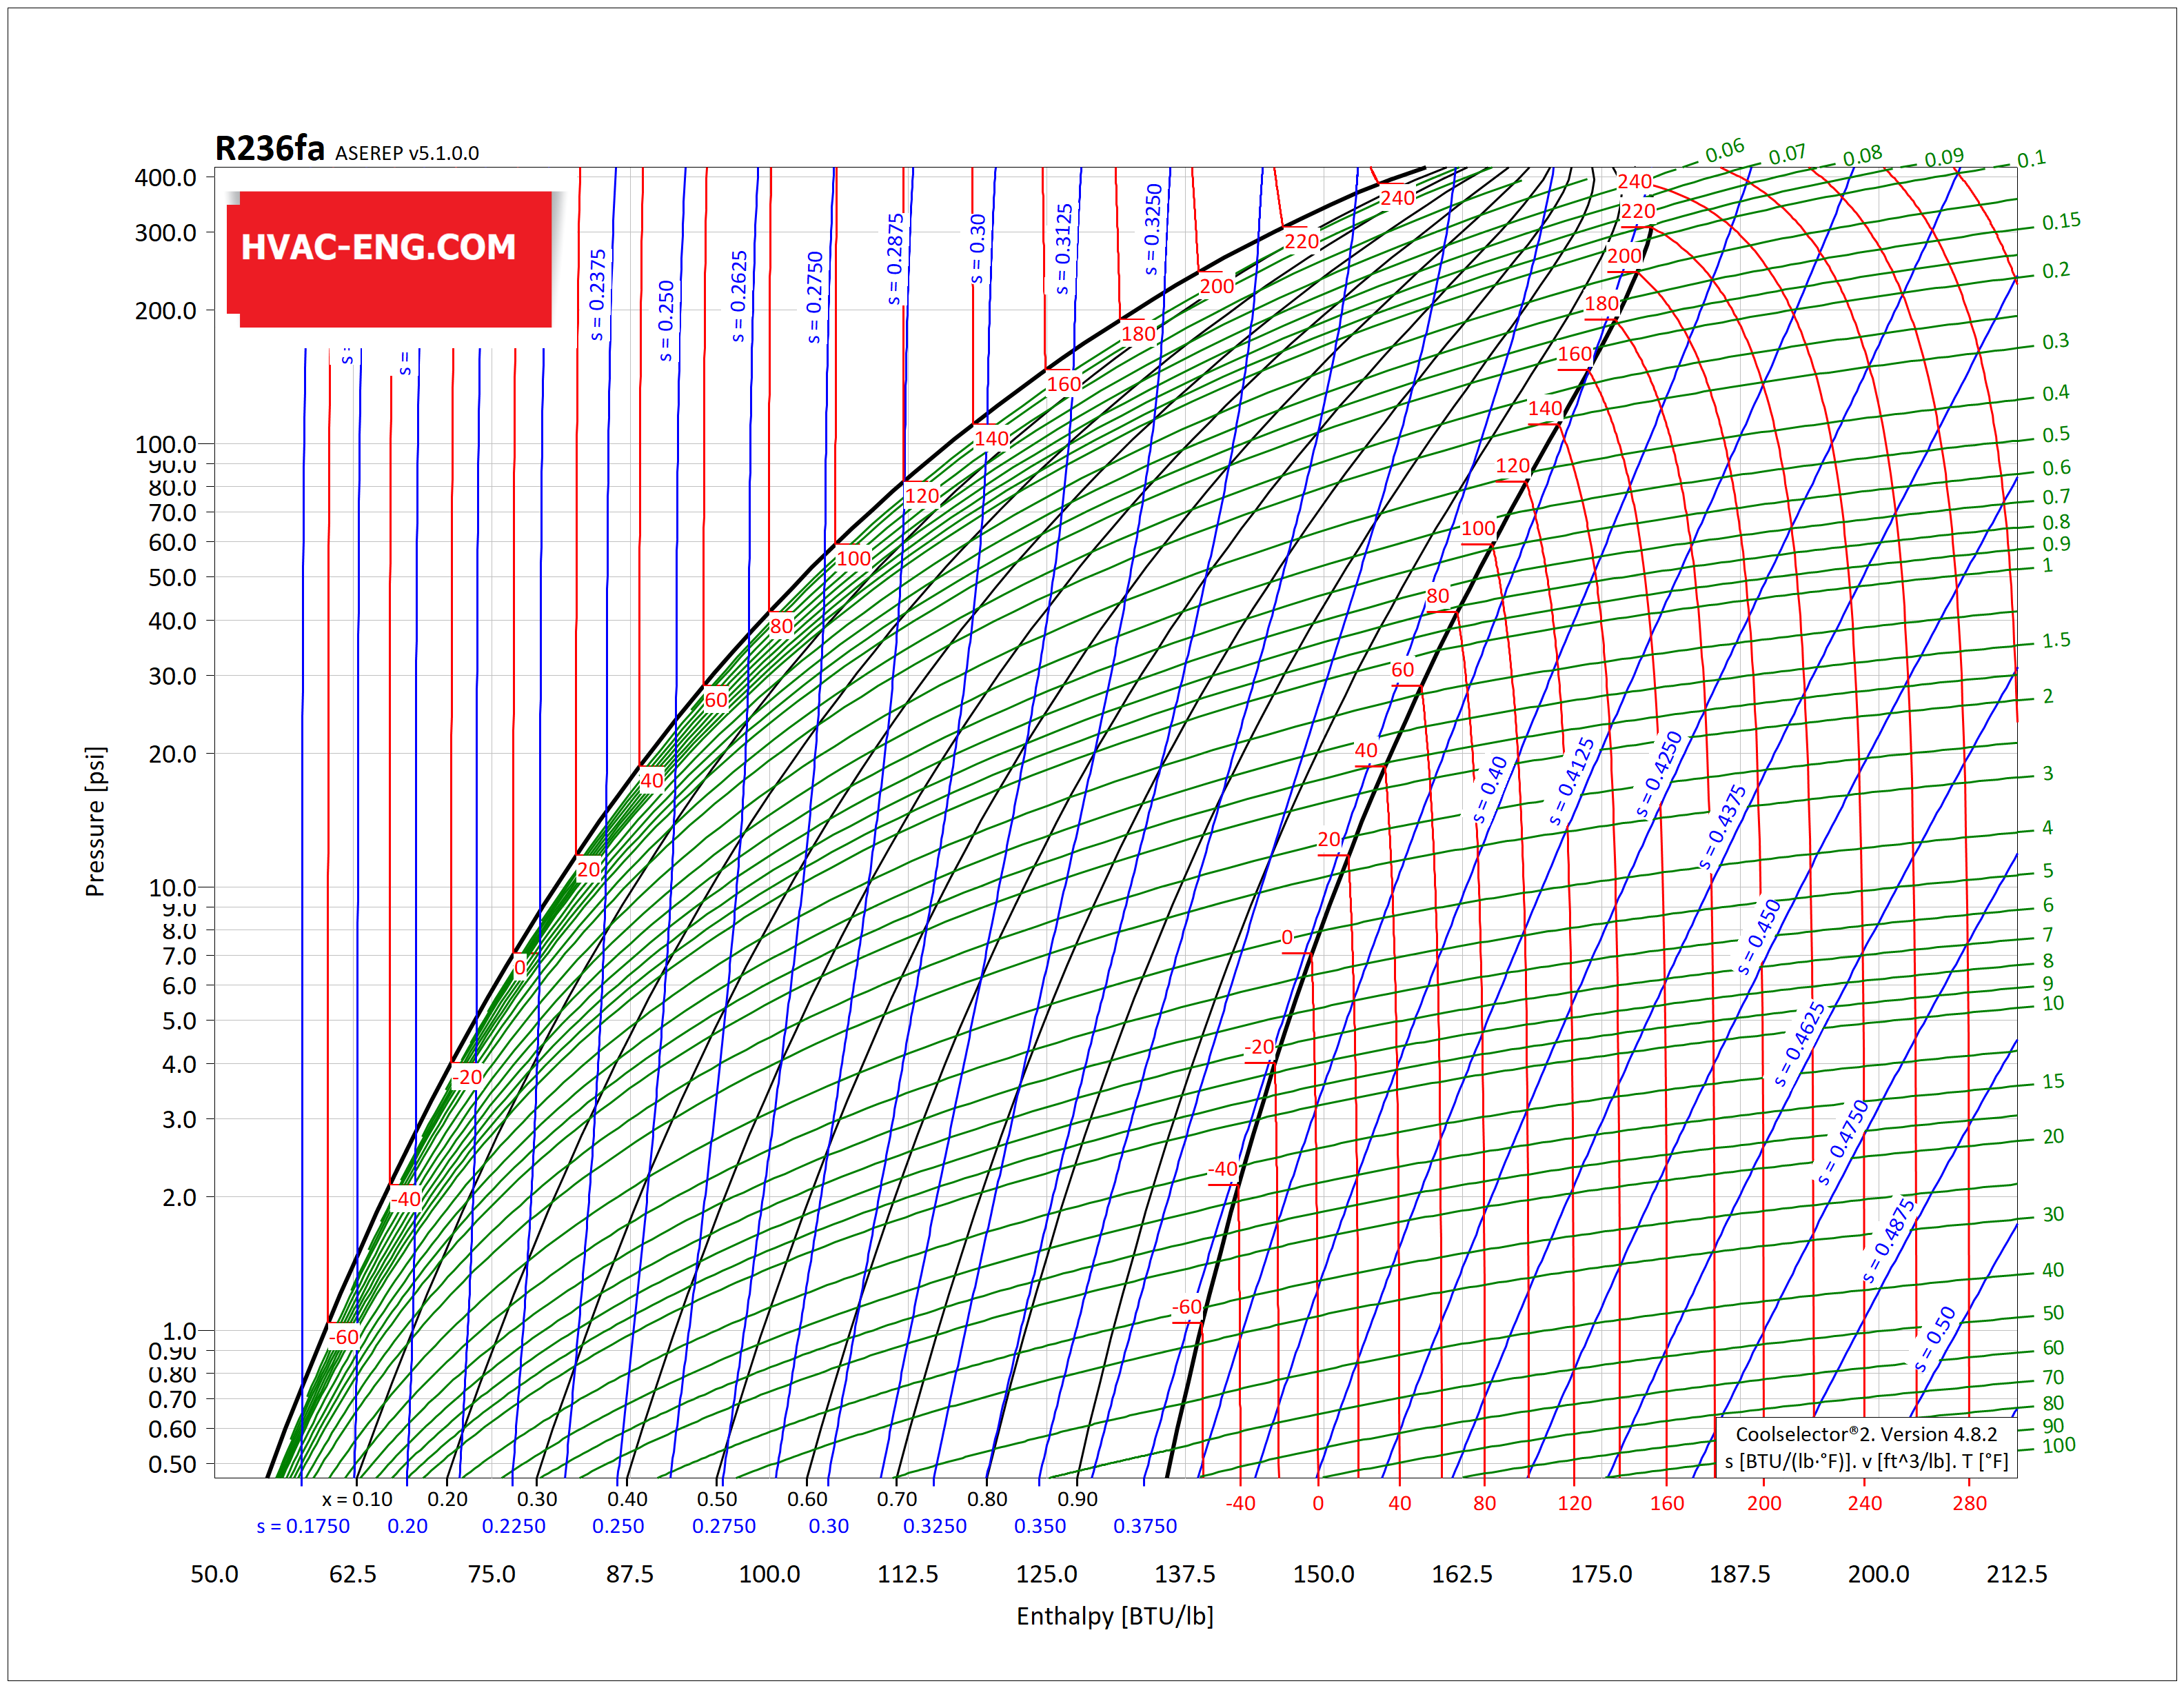
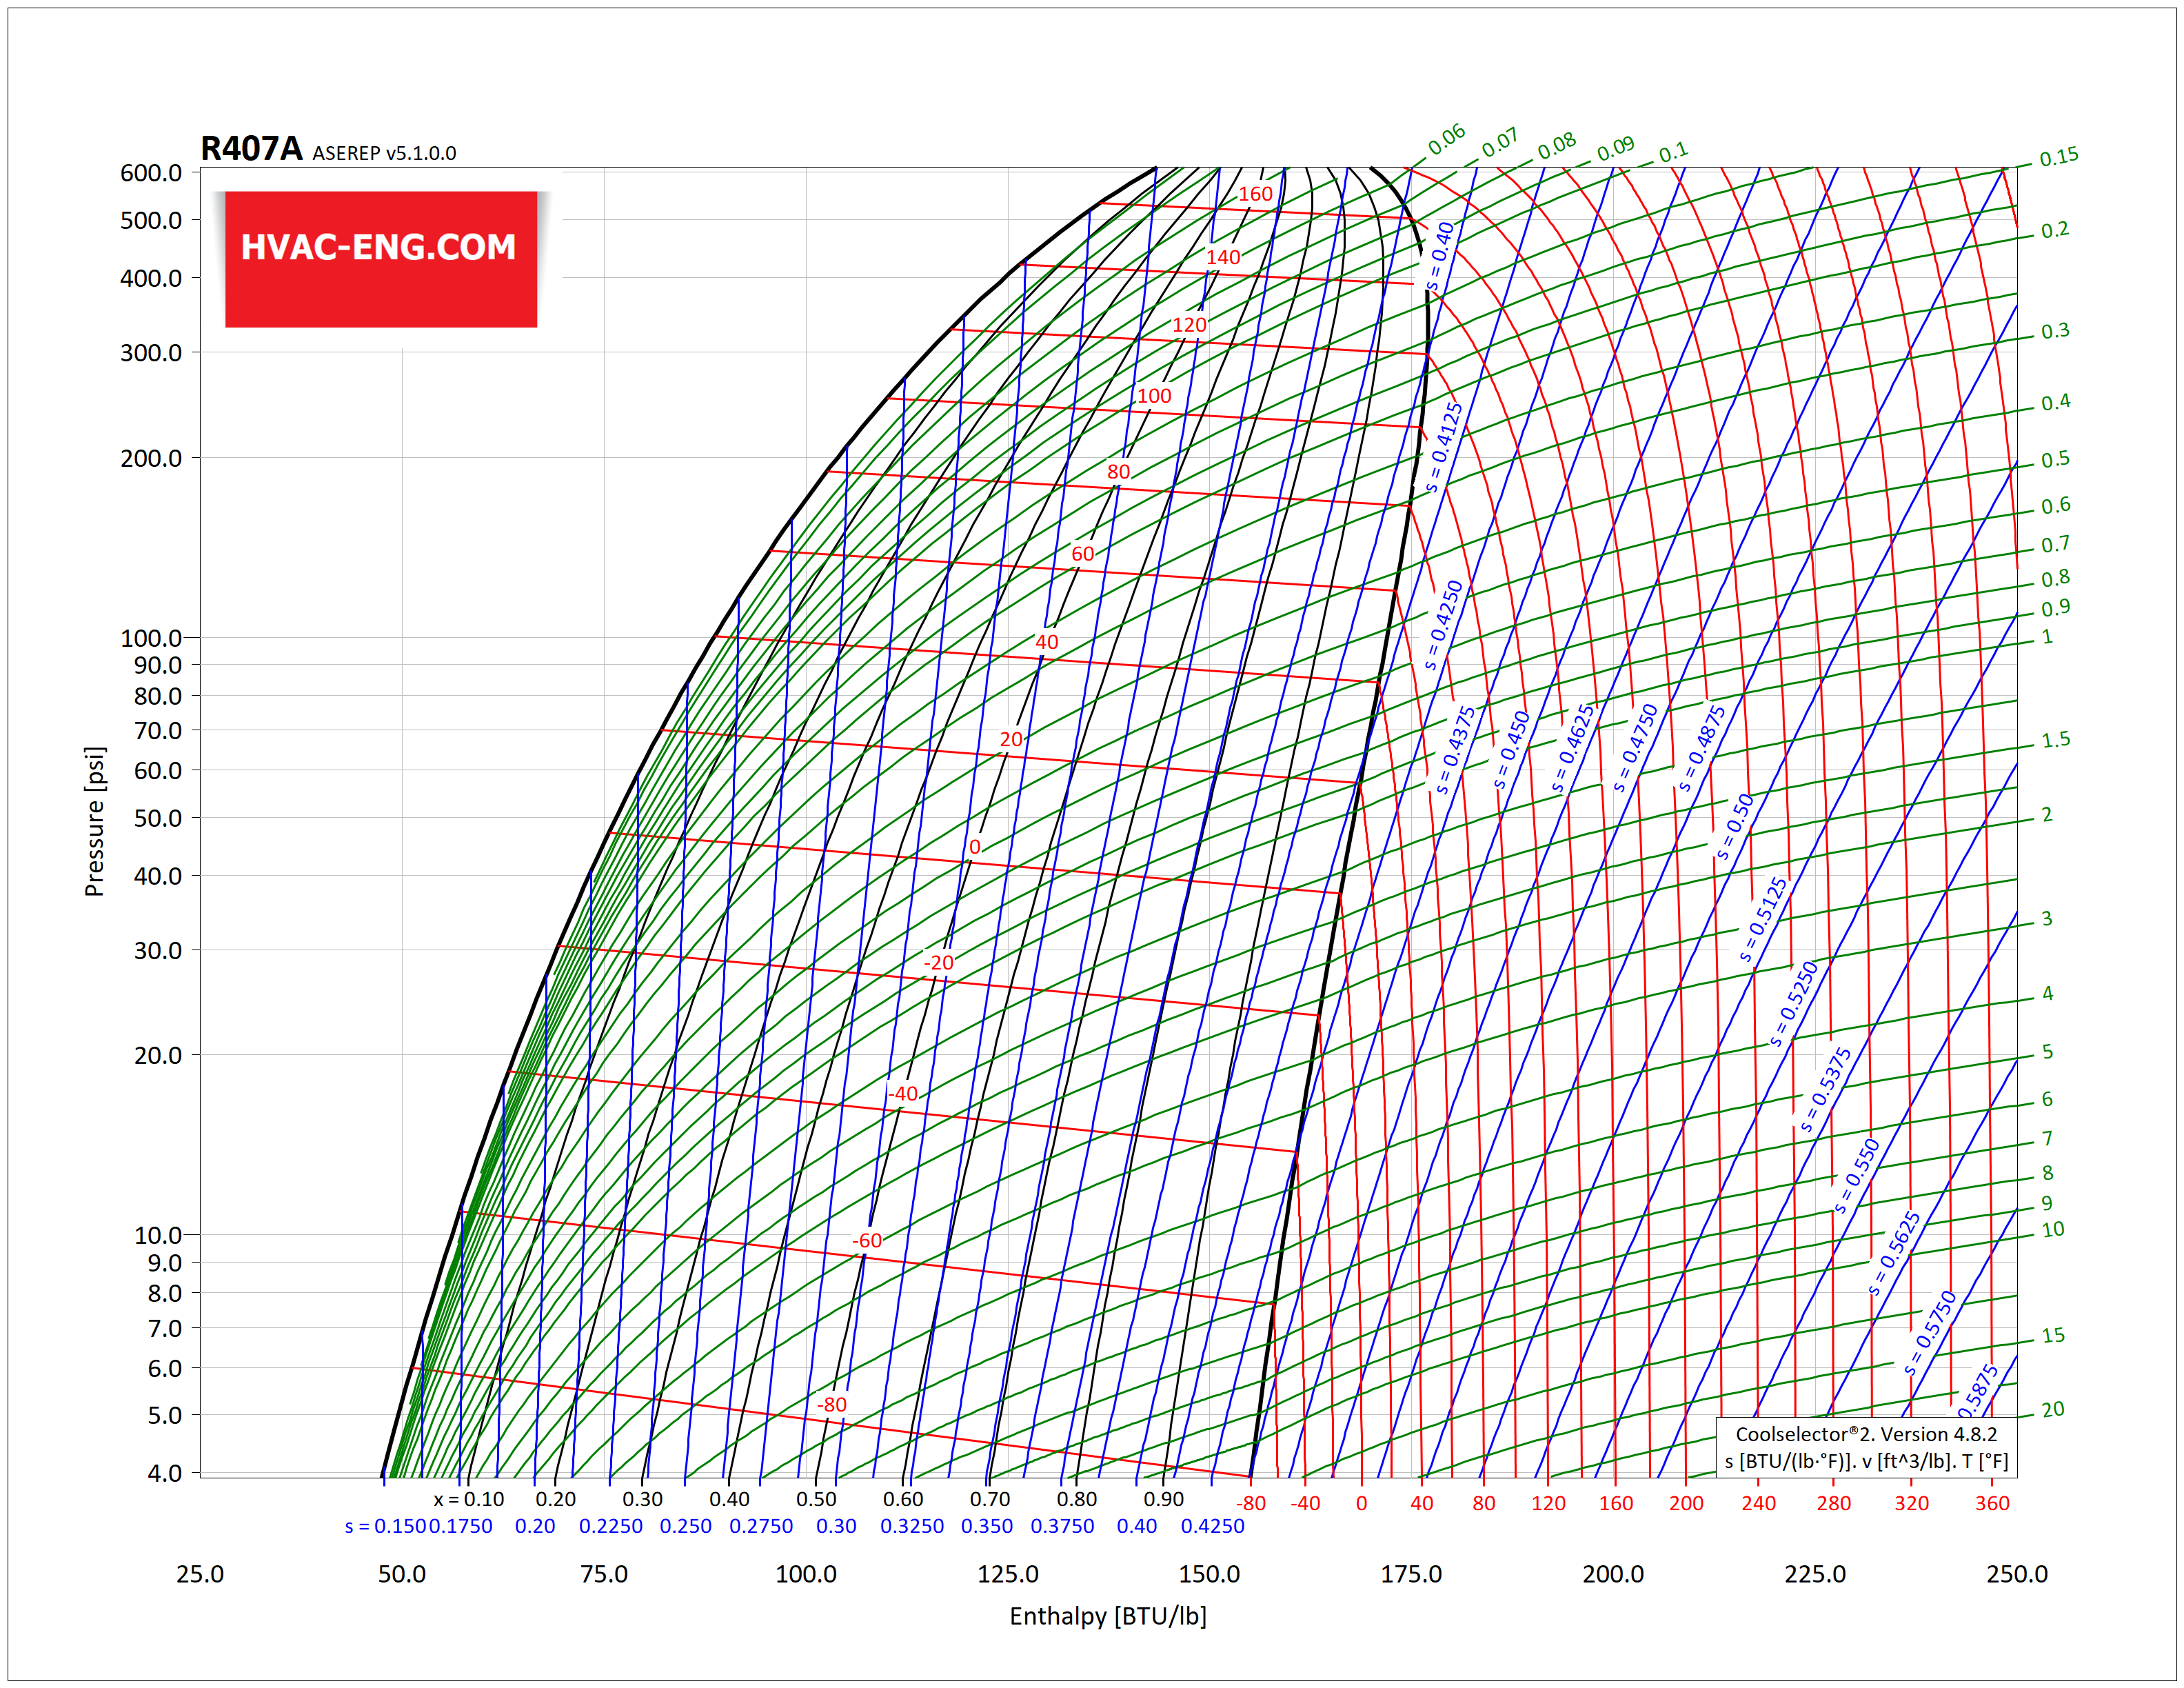
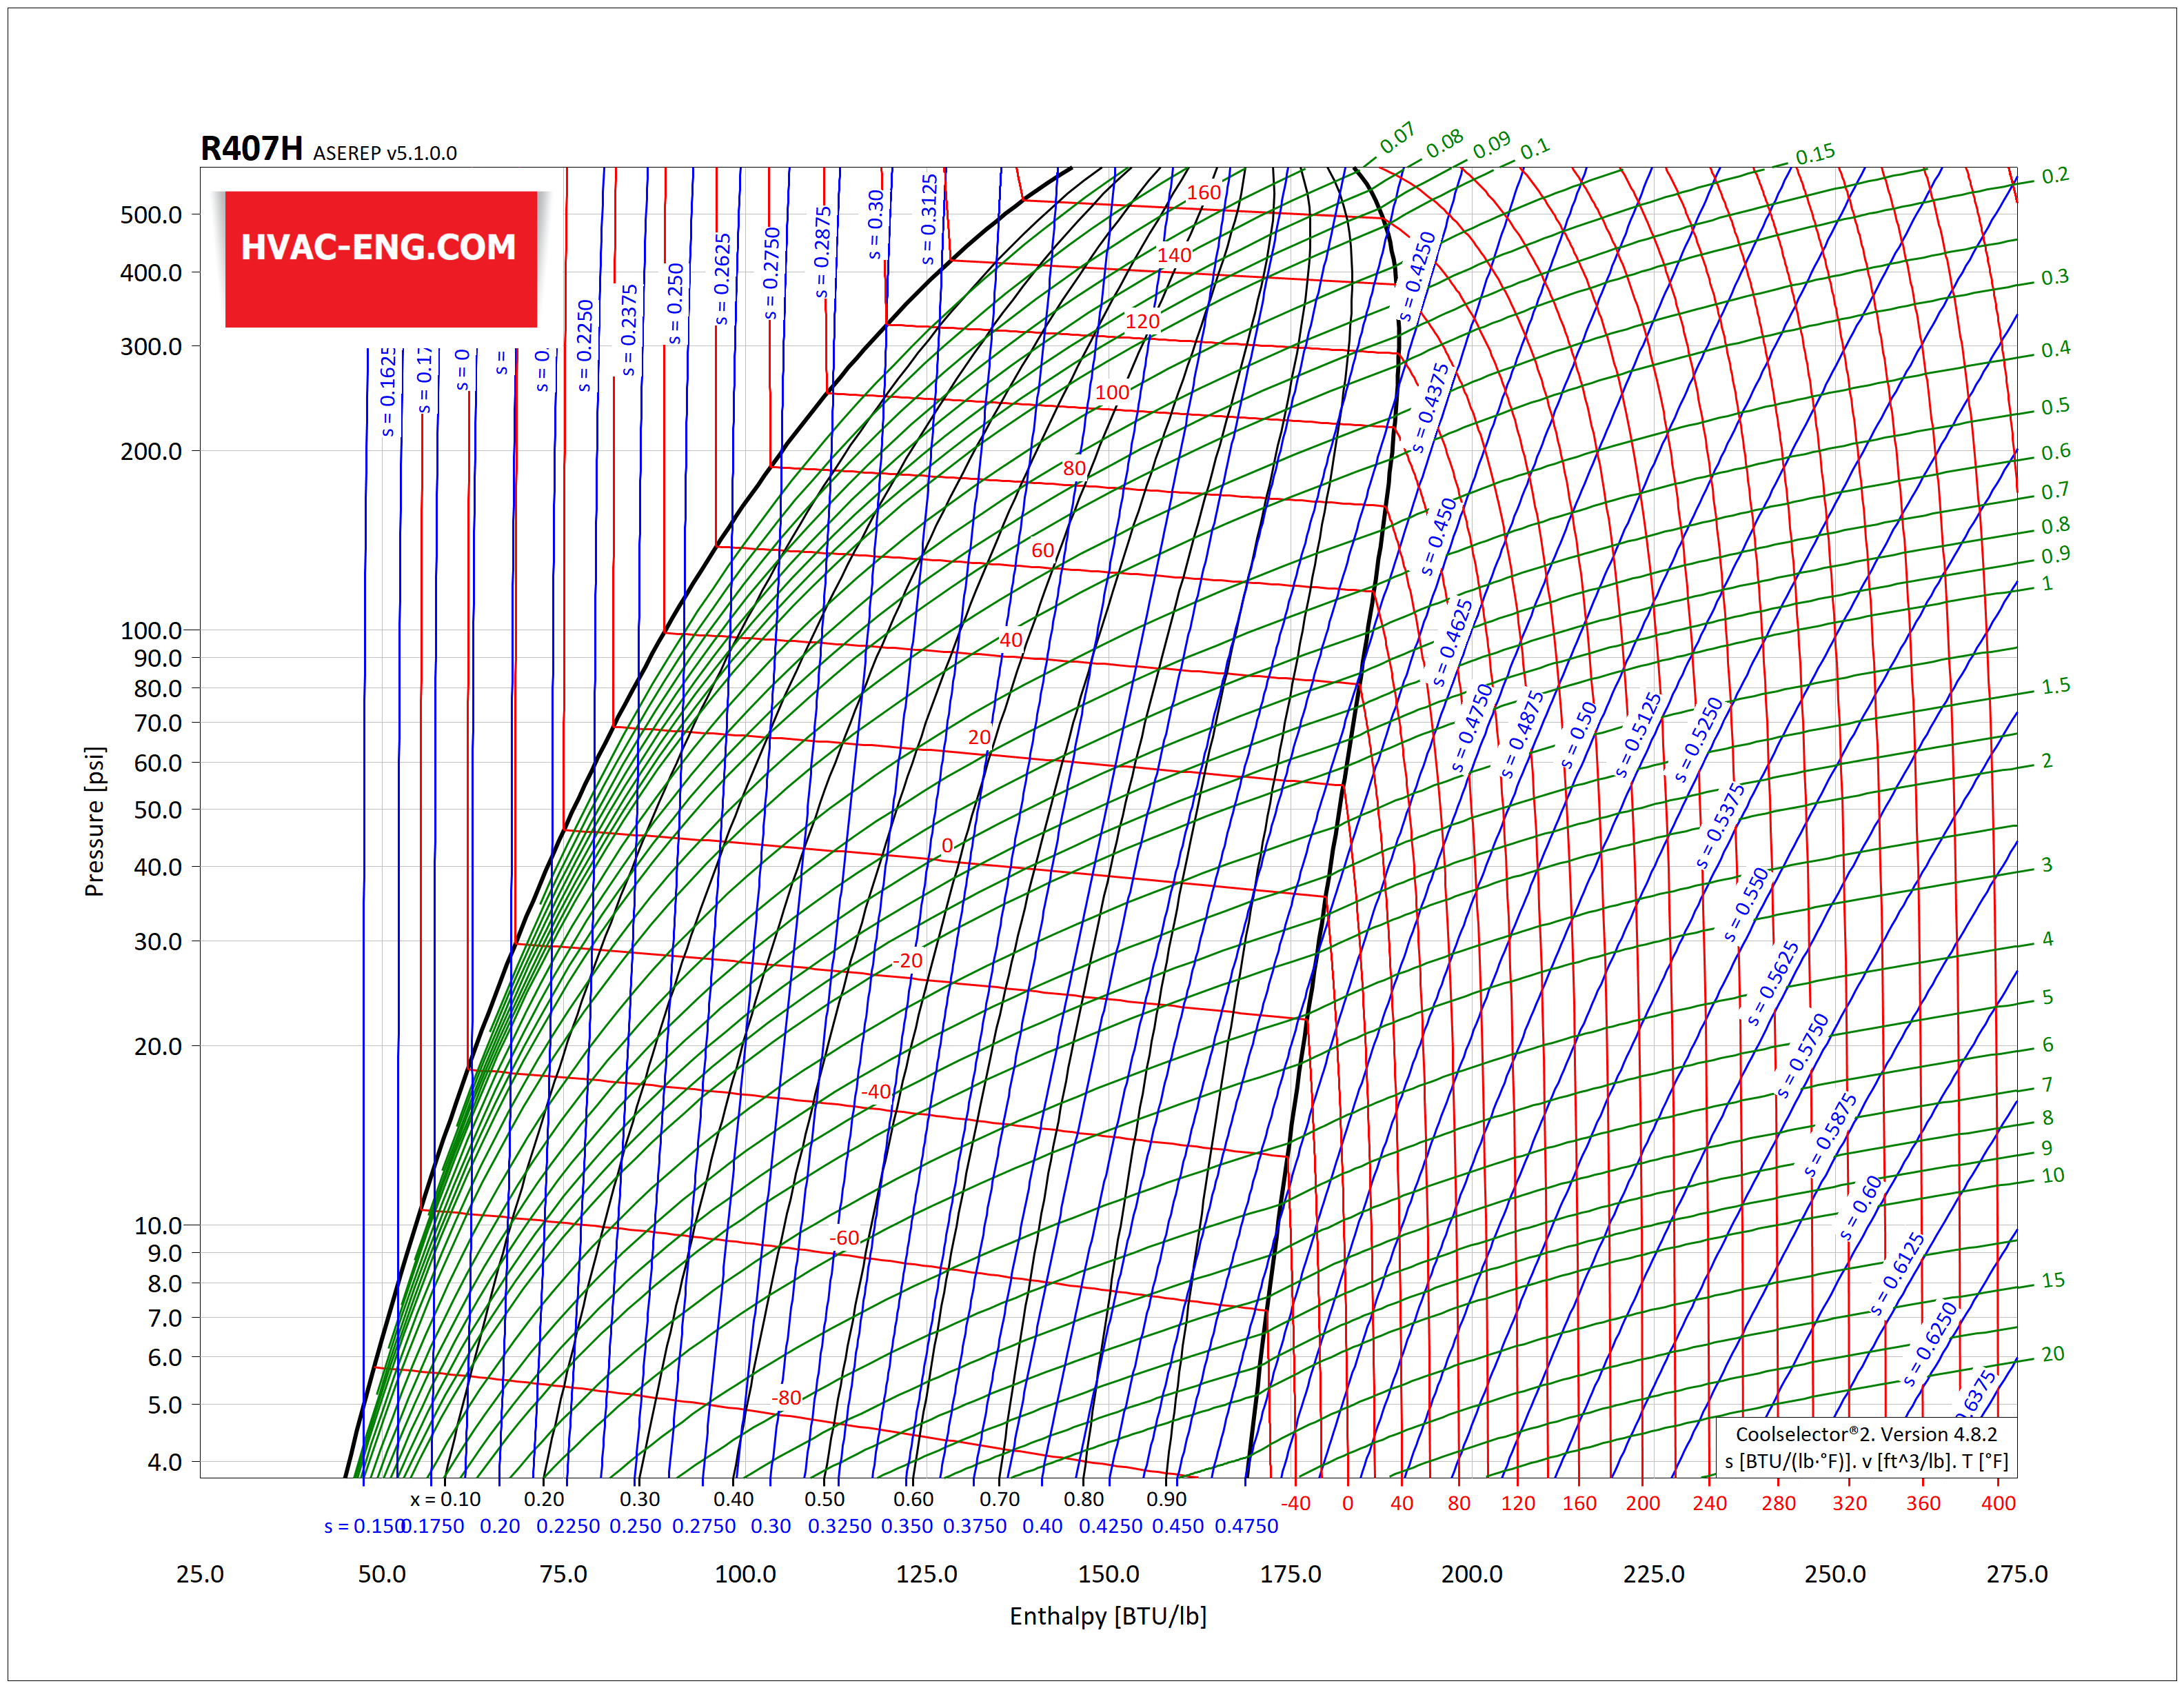
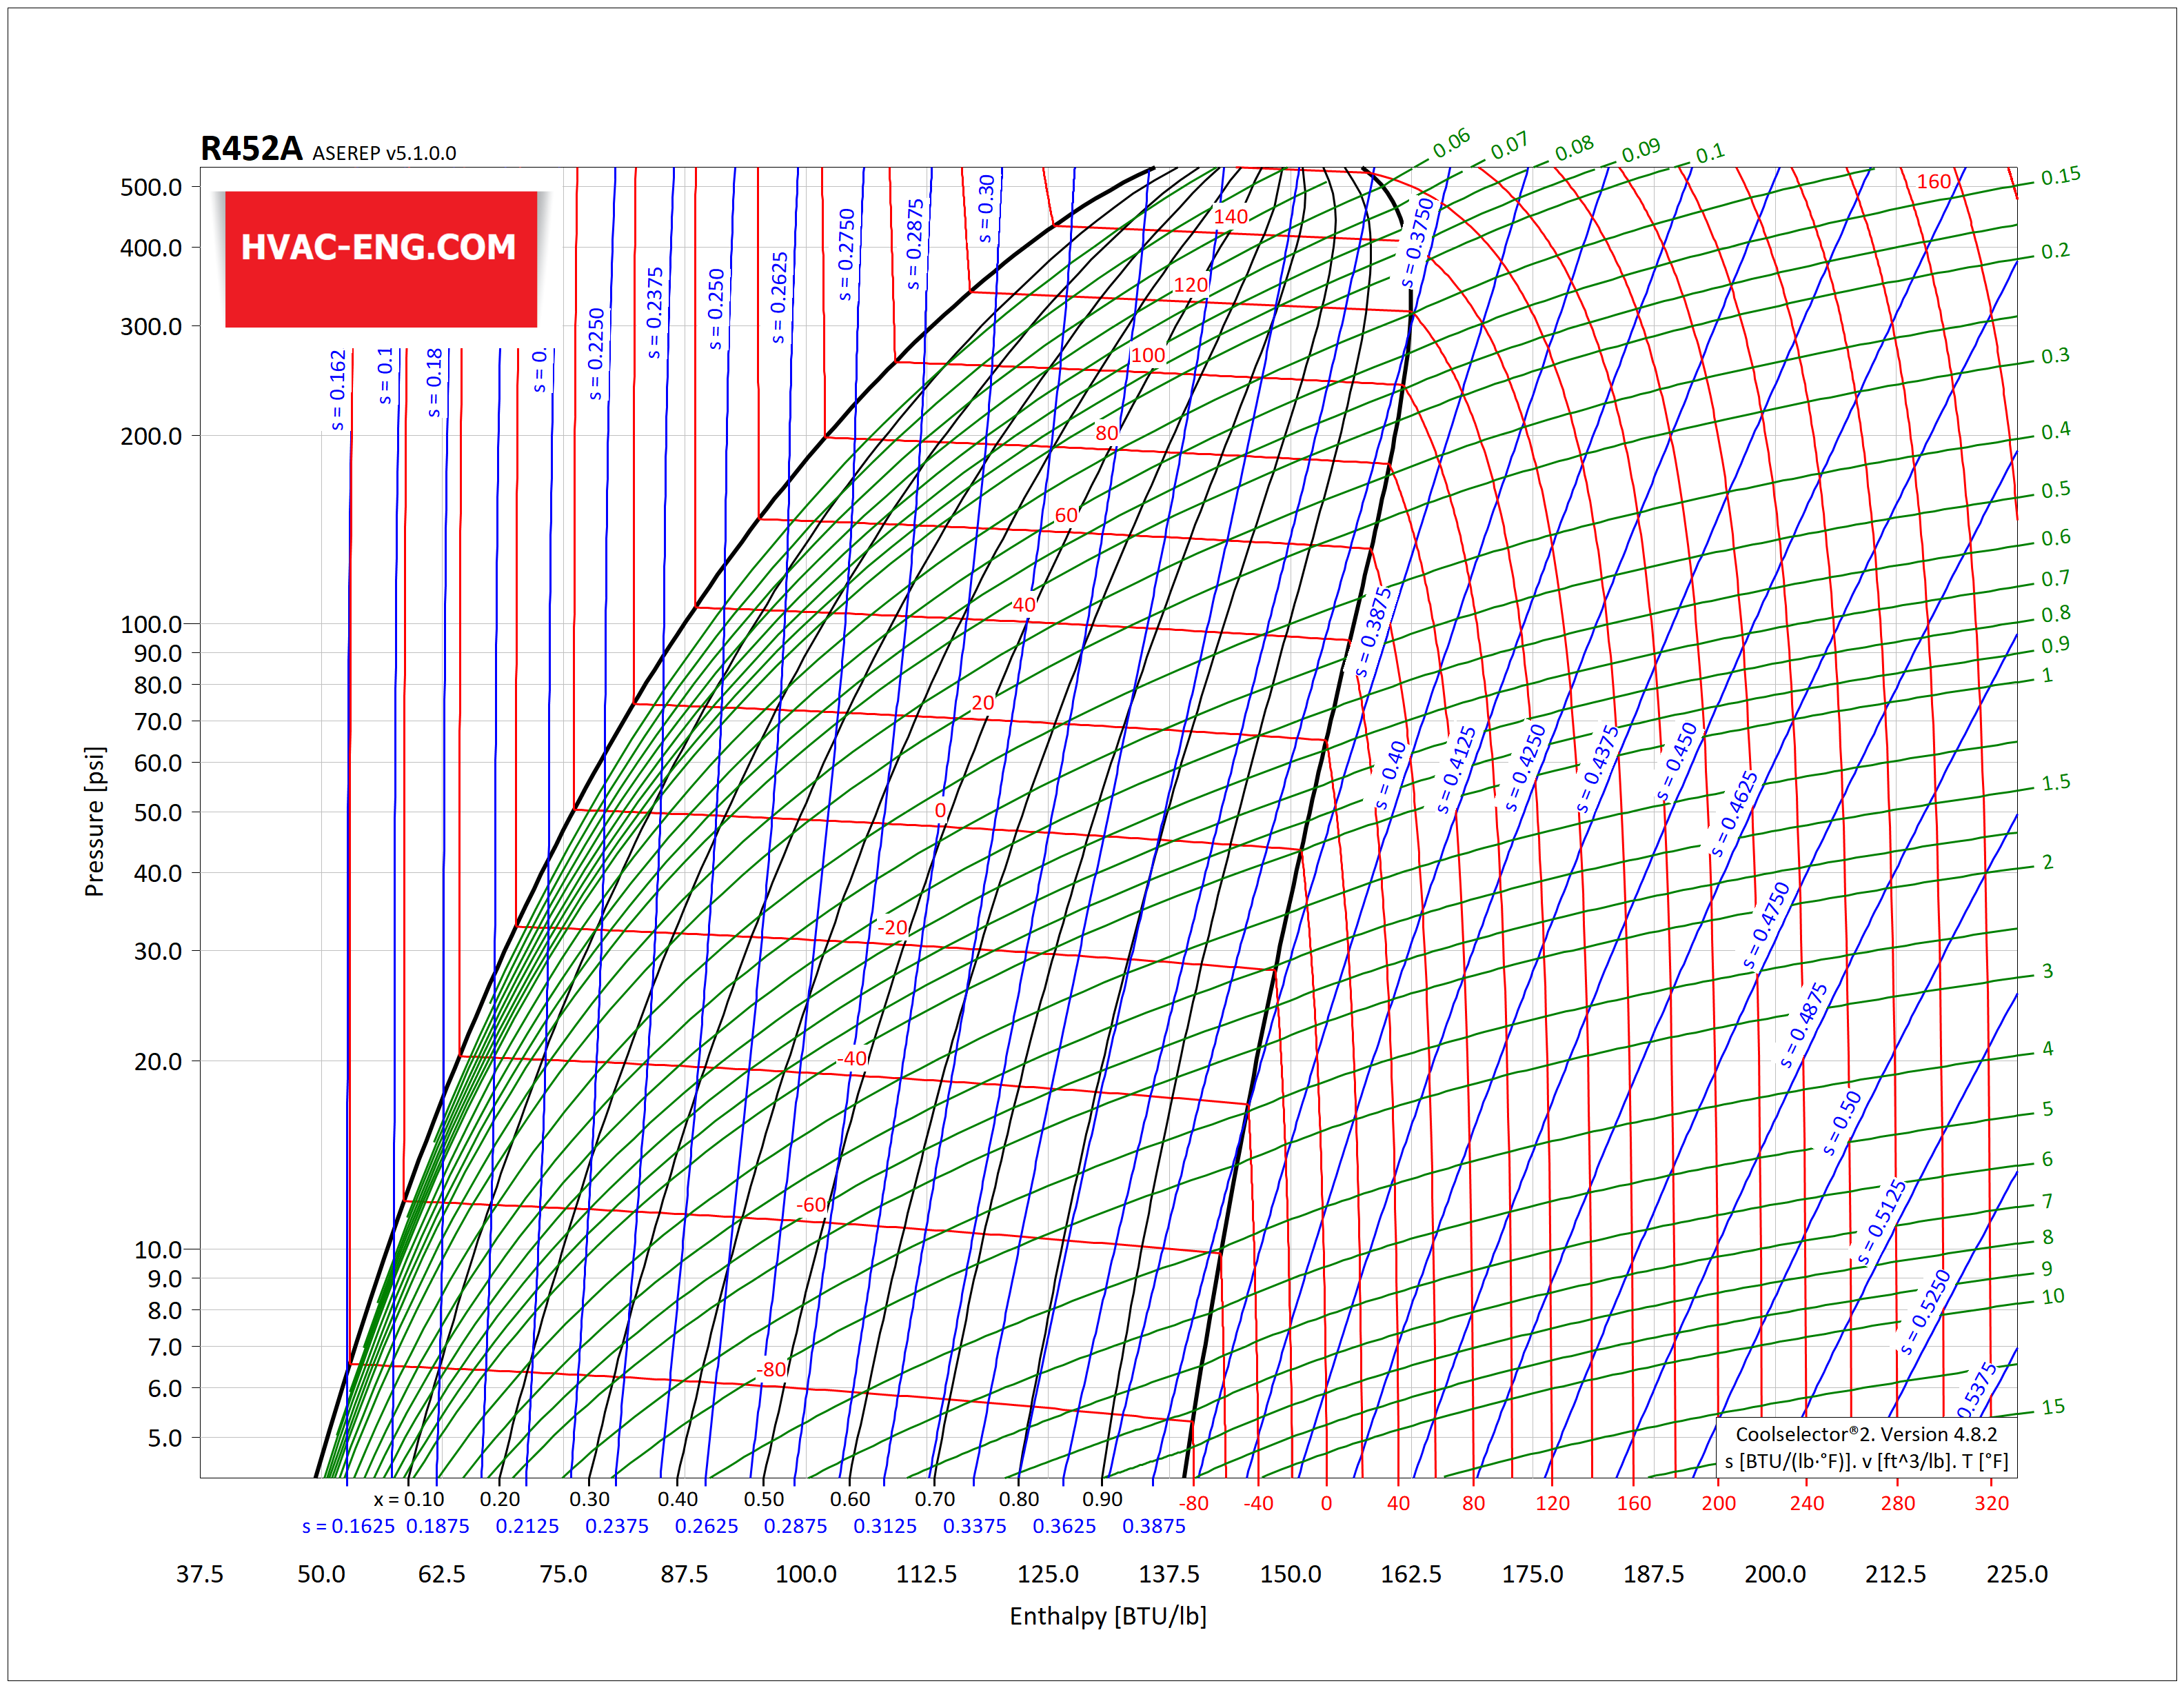
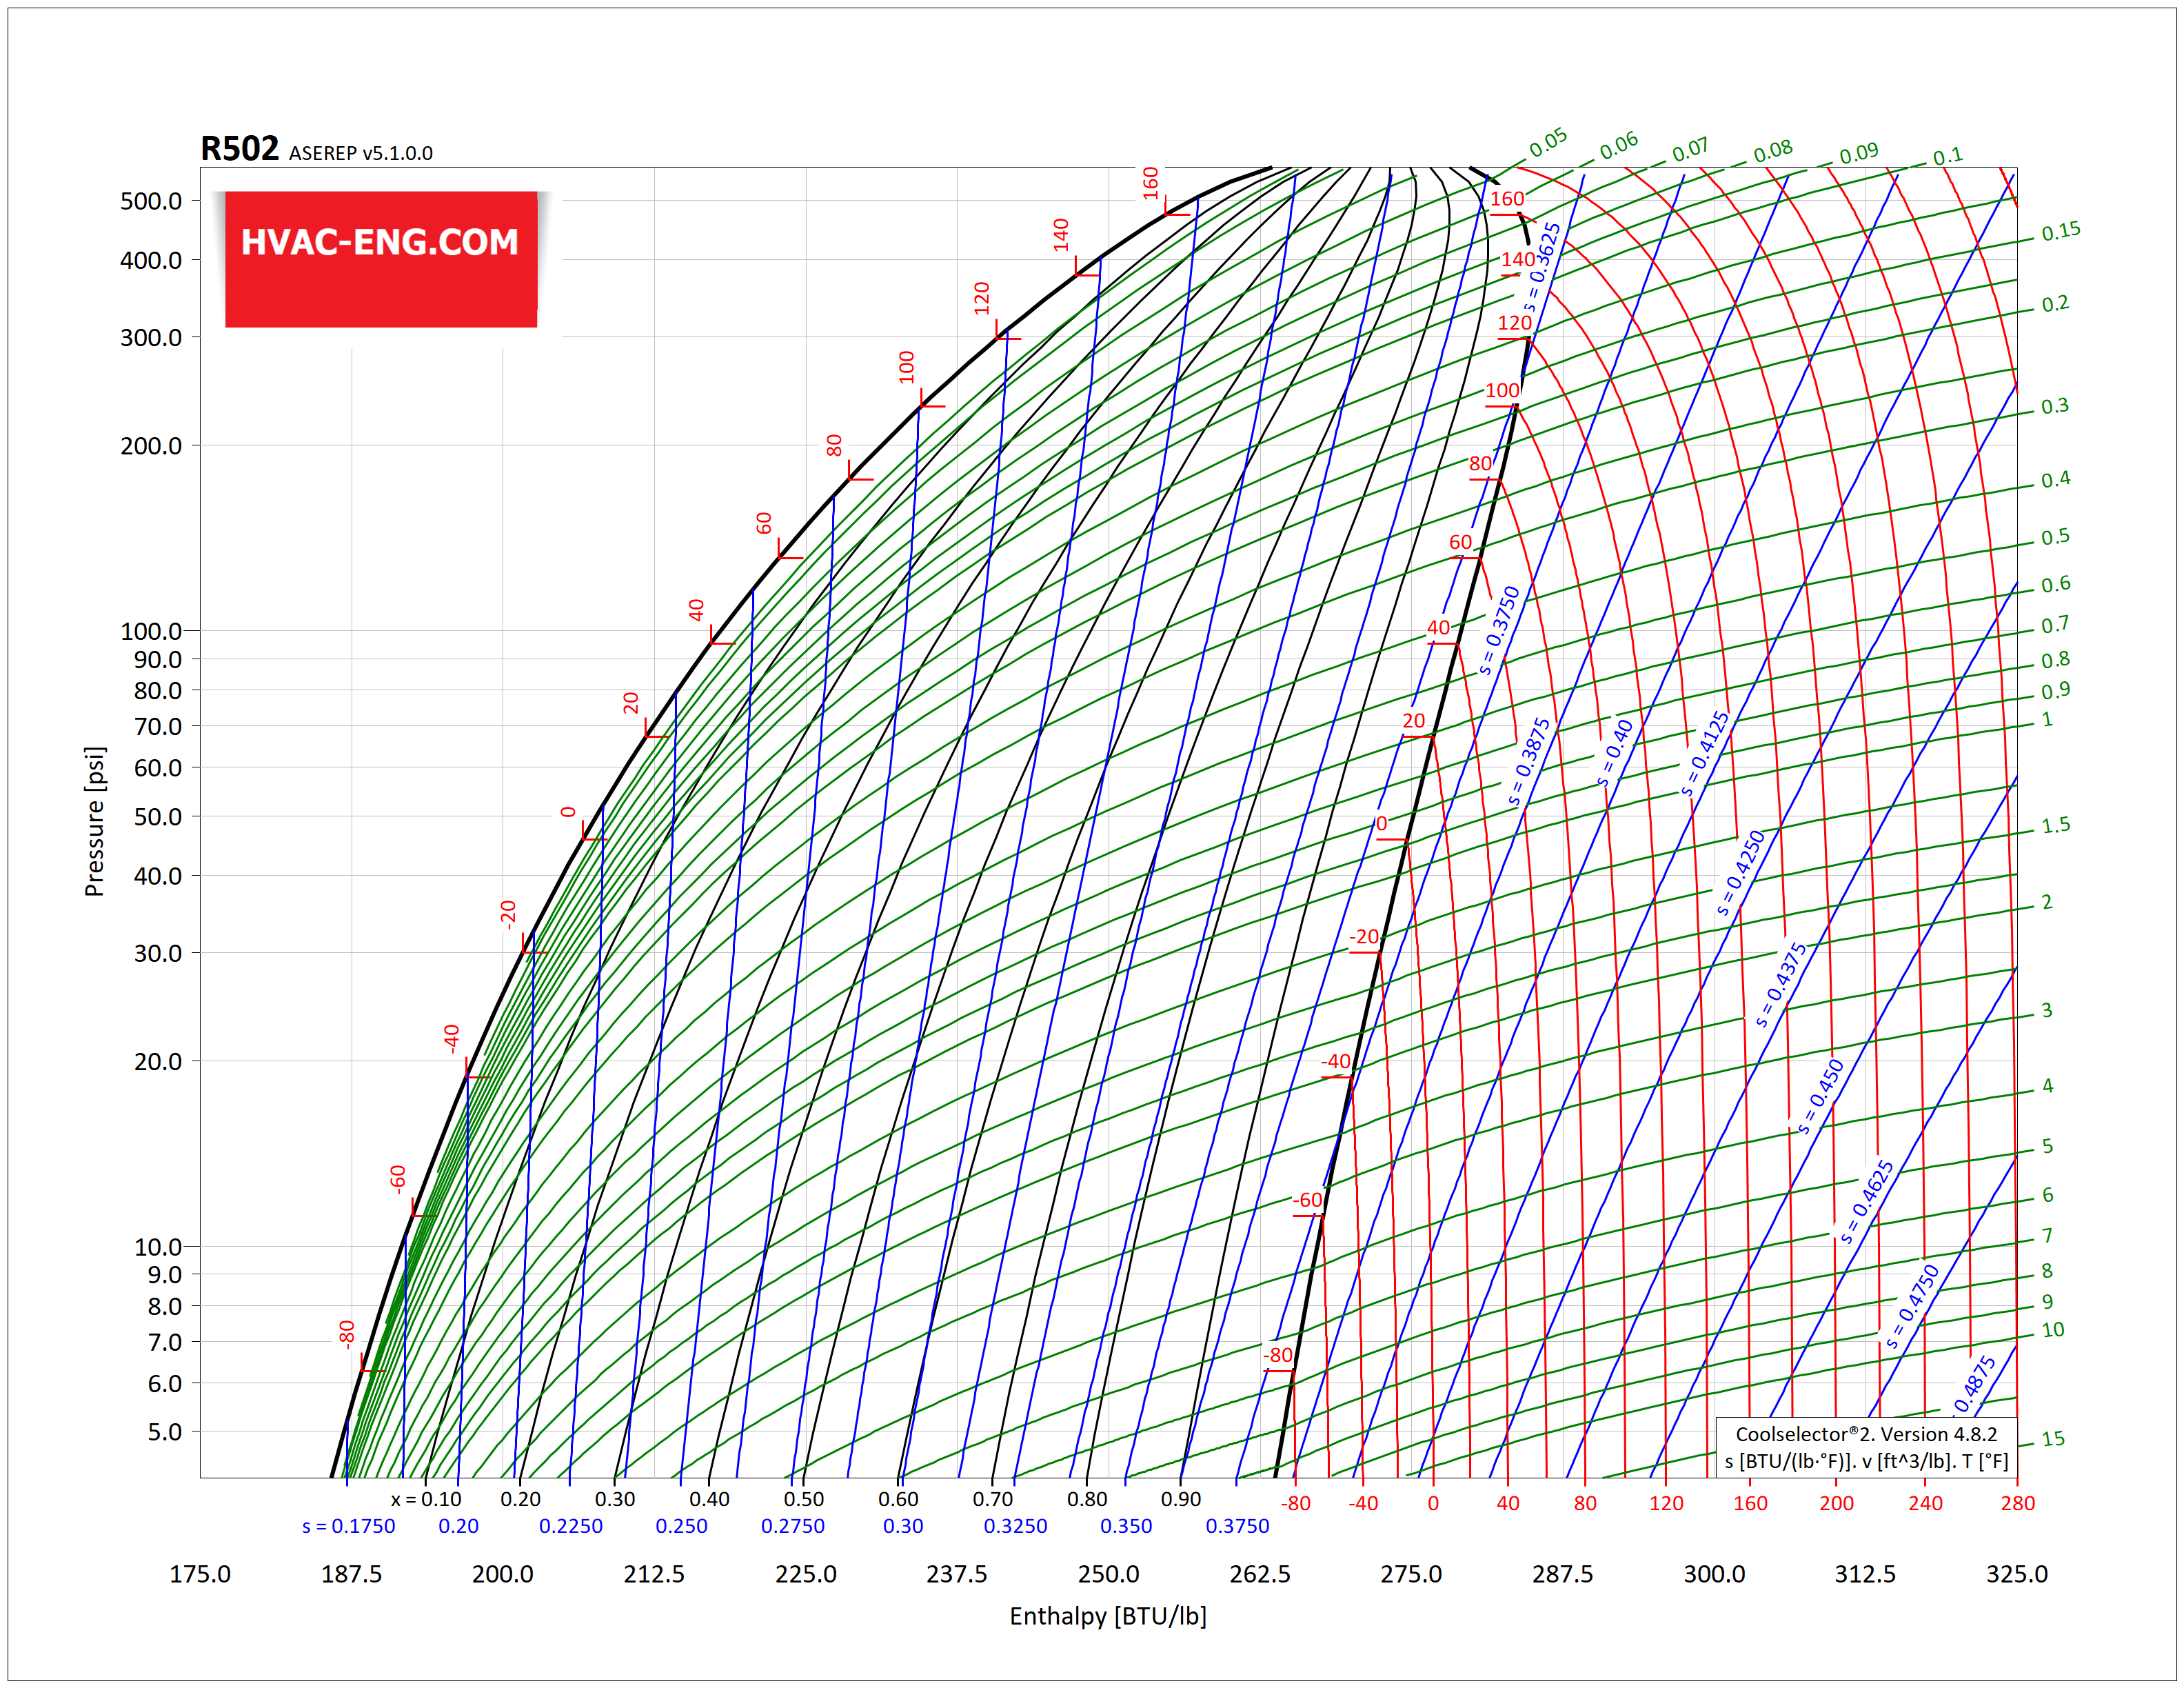
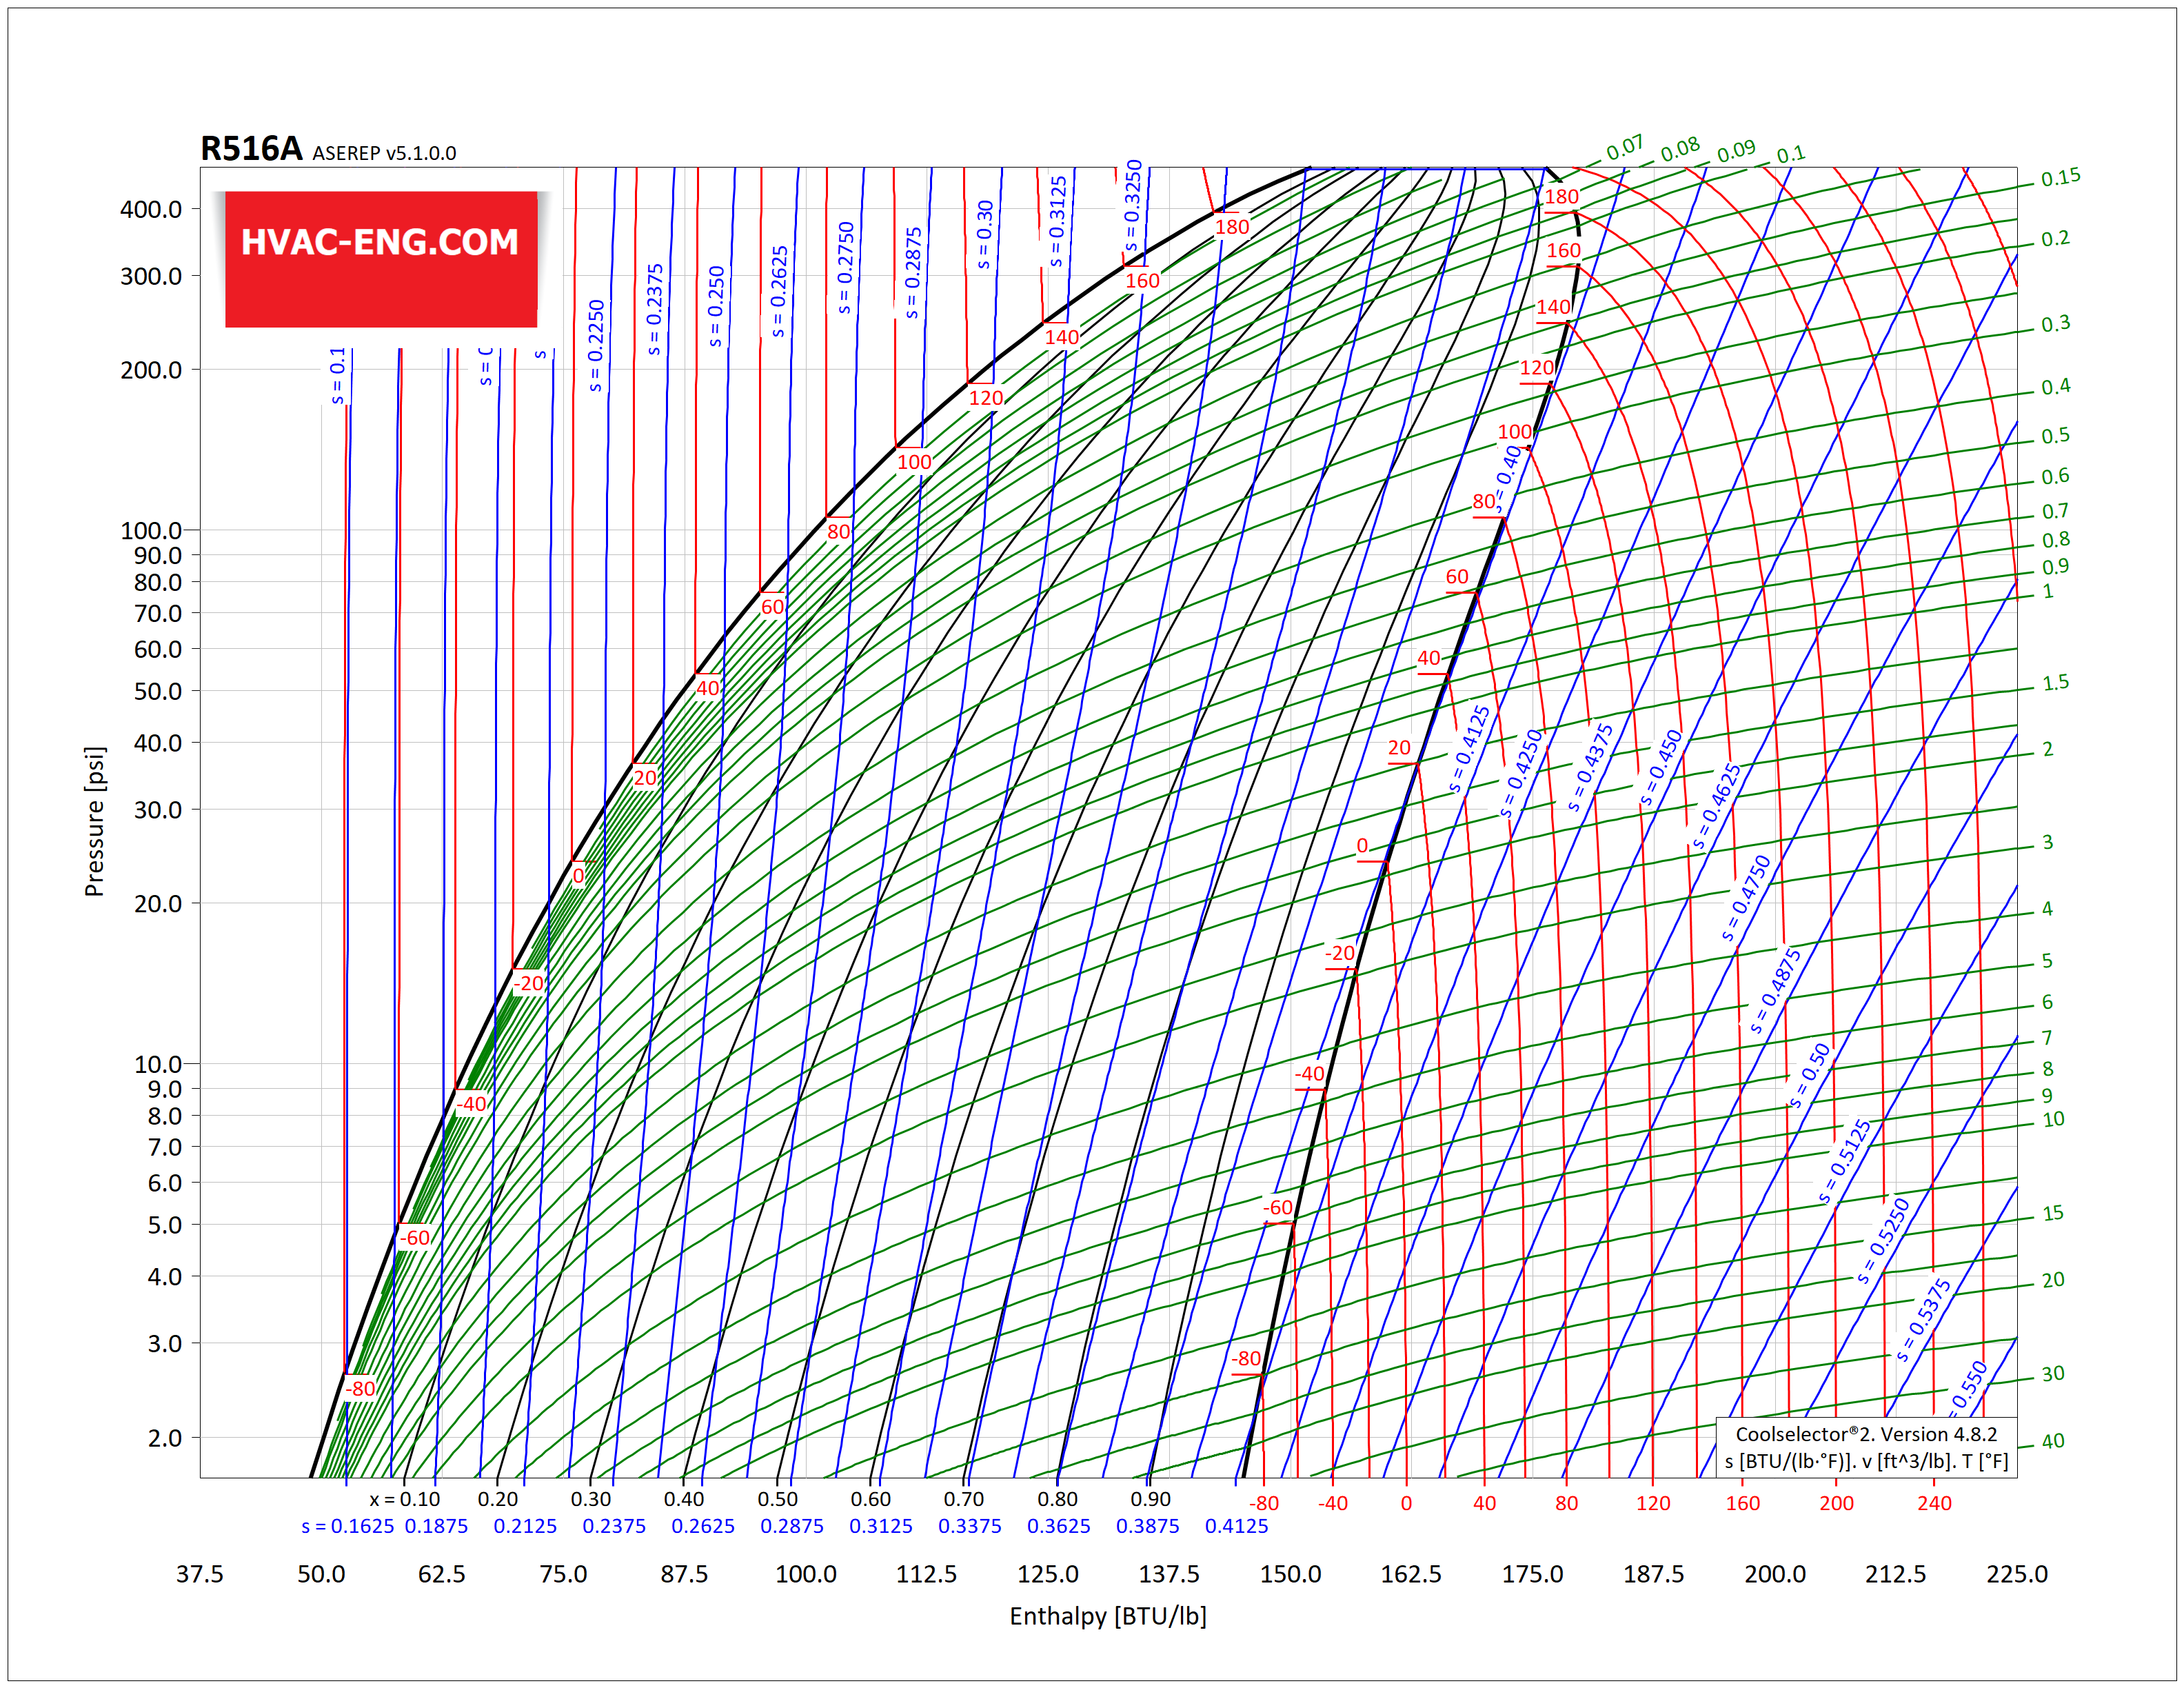
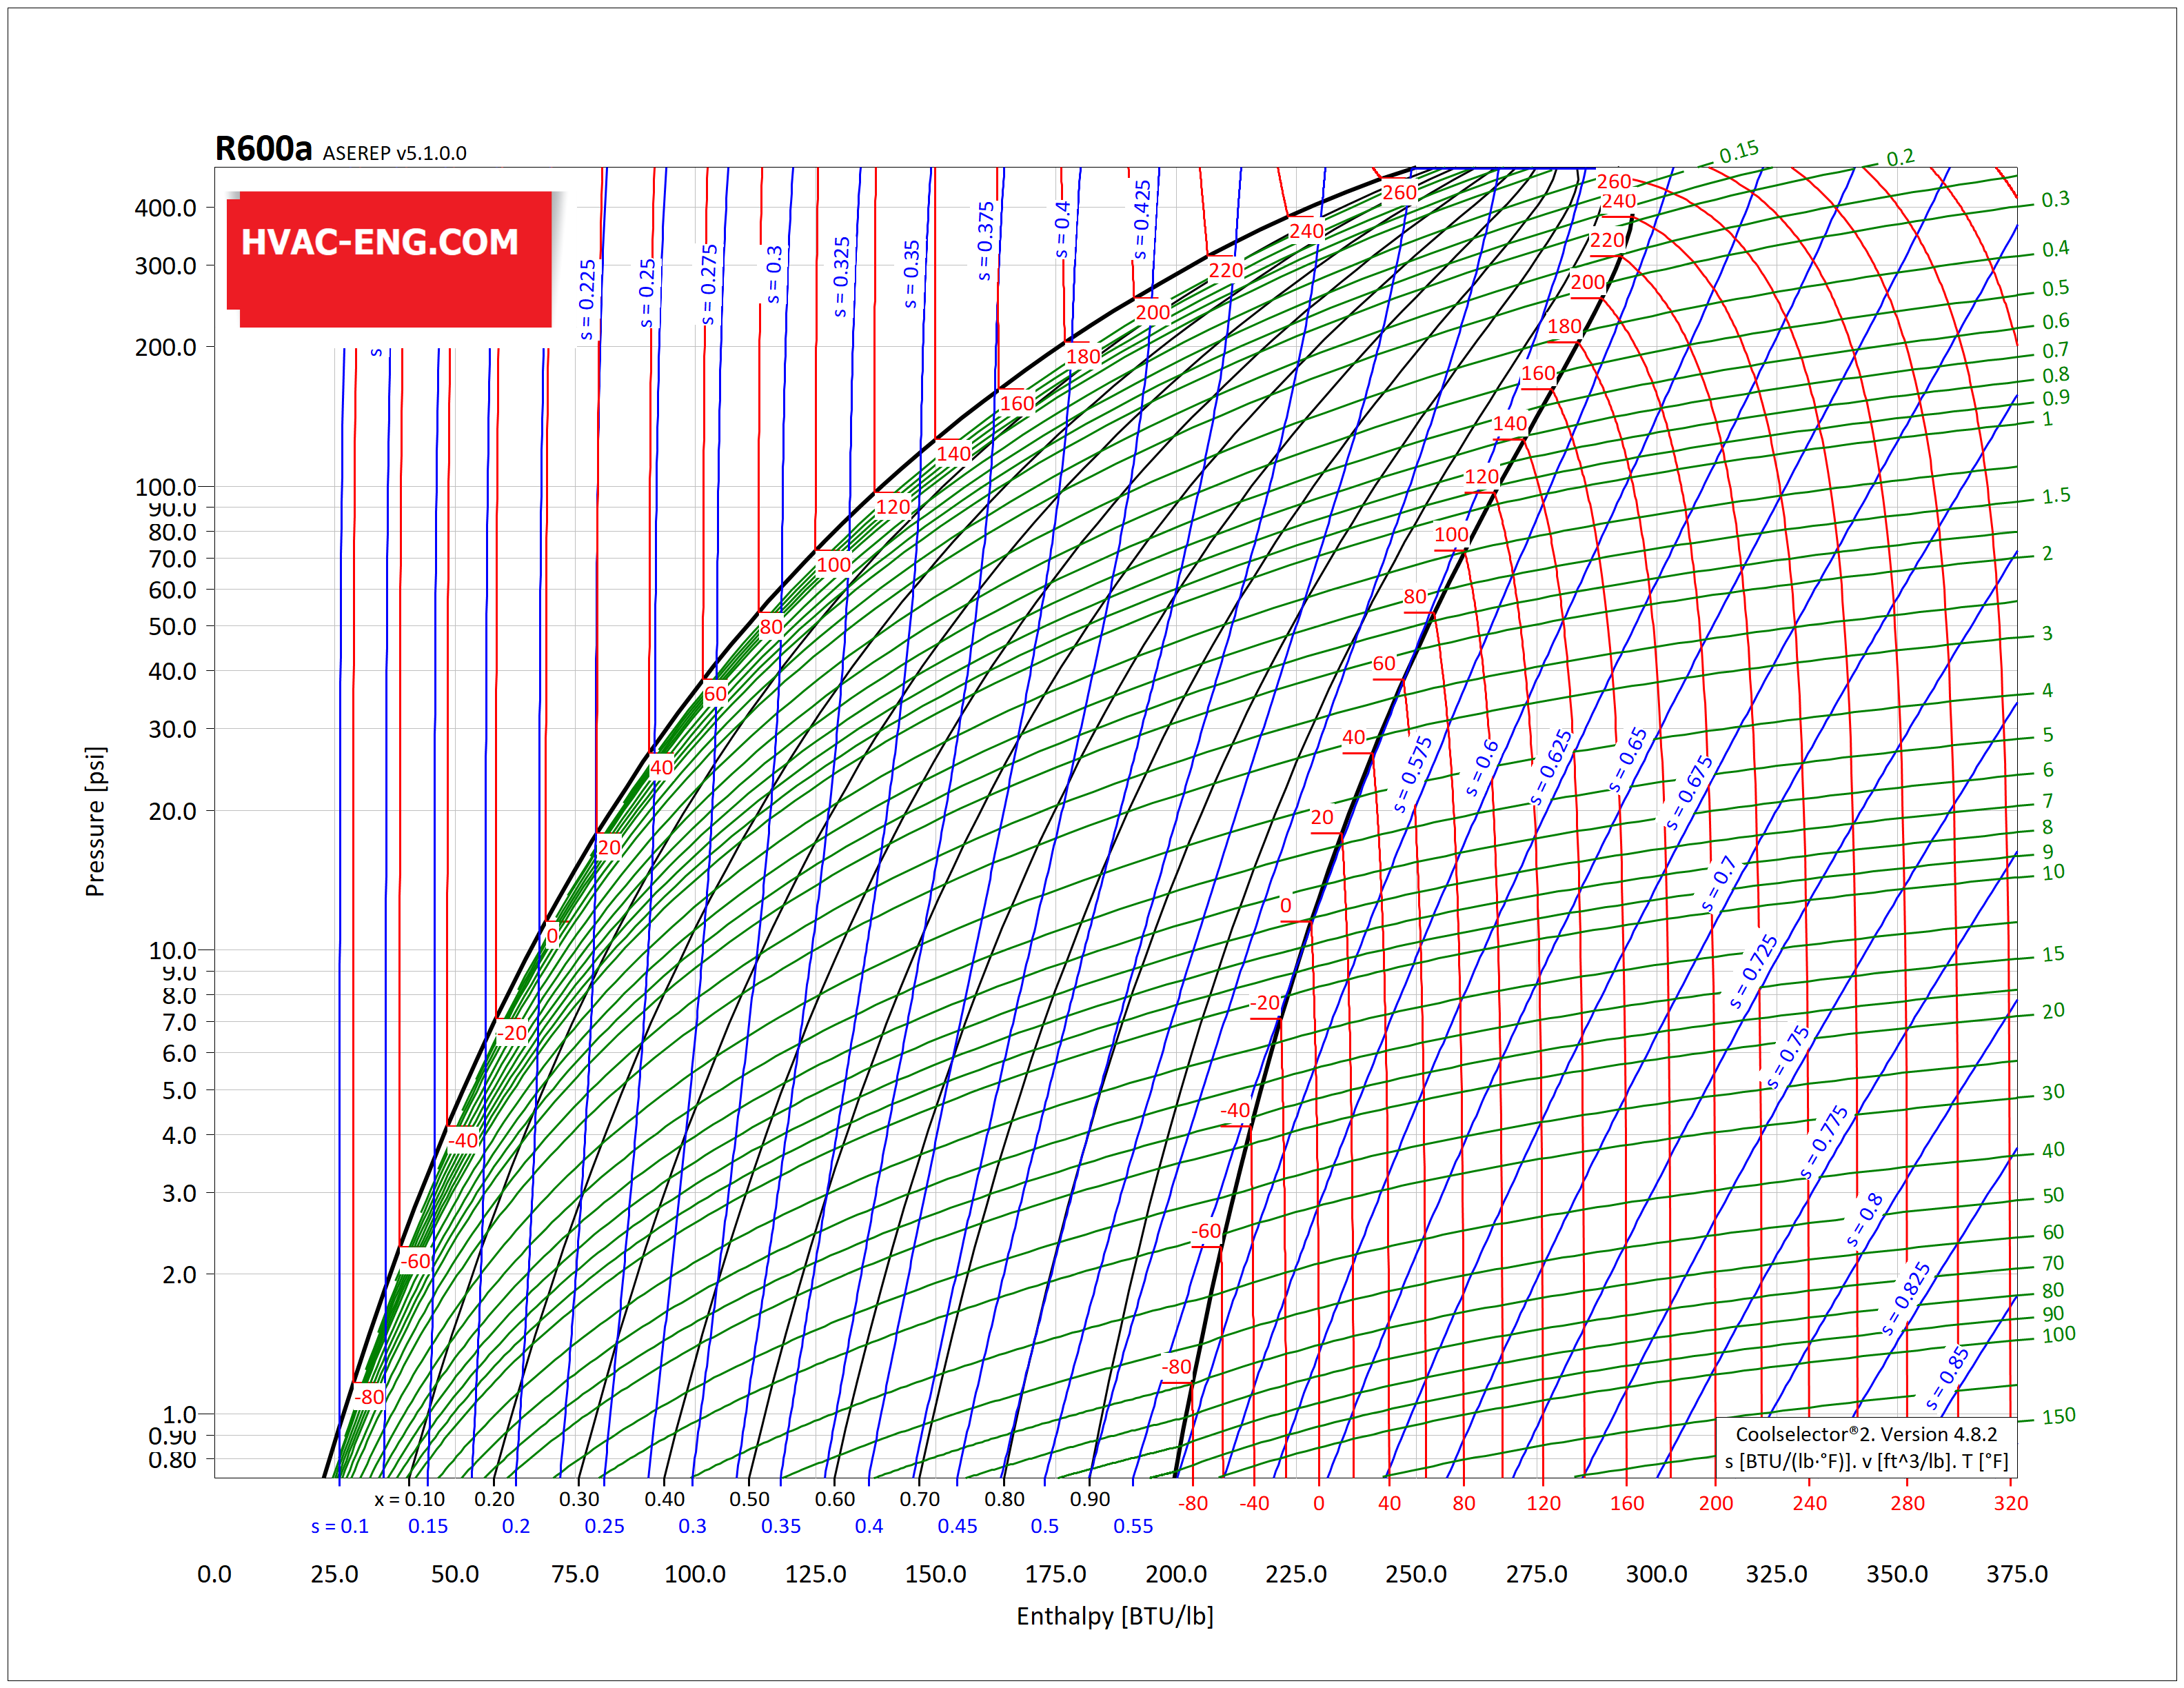
The pressure-enthalpy diagram is the most common graphical tool for analysis and calculation of the heat and work transfer and performance of a refrigeration cycle. The change in pressure can be clearly illustrated on the p-h diagram. Also, both heat and work transfer of various processes can be calculated as the change of enthalpy and at easily shown on the p-h diagram.

DOWNLOAD – P-h enthalpy diagram consist of following lines:
- Constant pressure lines
- Constant enthalpy lines
- Saturation line
- Isothermal lines
- Isentropic lines
- Constant volume lines
Enthalpy “h” is along x-axis and absolute pressure “p” is along the y-axis, both expressed in logarithmic scale. The saturated liquid line separates the sub-cooled liquid from the two-phase region in which vapor and liquid refrigerants coexist. The saturated vapor line separates this two-phase region from the superheated vapor. In the two-phase region, the constant-dryness-fraction quality line subdivides the mixture of vapor and liquid. The constant-temperature lines are nearly vertical in the sub-cooled liquid region. At higher temperatures, they are curves near the saturated liquid line. In two-phase region, the constant temperature lines are horizontal. Also in the superheated region, the constant-entropy lines incline sharply upward, and constant volume lines are flatter. Both are slightly curved.
This article is a continuation of our older article, which was well received by users, so we decided to update the P-H Diagram list and provide you with a more complete list of the world's commercial refrigerants.
You can easily access the high quality refrigerant chart by clicking on the refrigerants listed in the table.


_PH_Diagram.png)
_PH_Diagram.png)
_PH_Diagram.png)
_PH_Diagram.png)
_PH_Diagram.png)
_PH_Diagram.png)
_PH_Diagram.png)
_PH_Diagram.png)