冷媒のPh線図(その2)

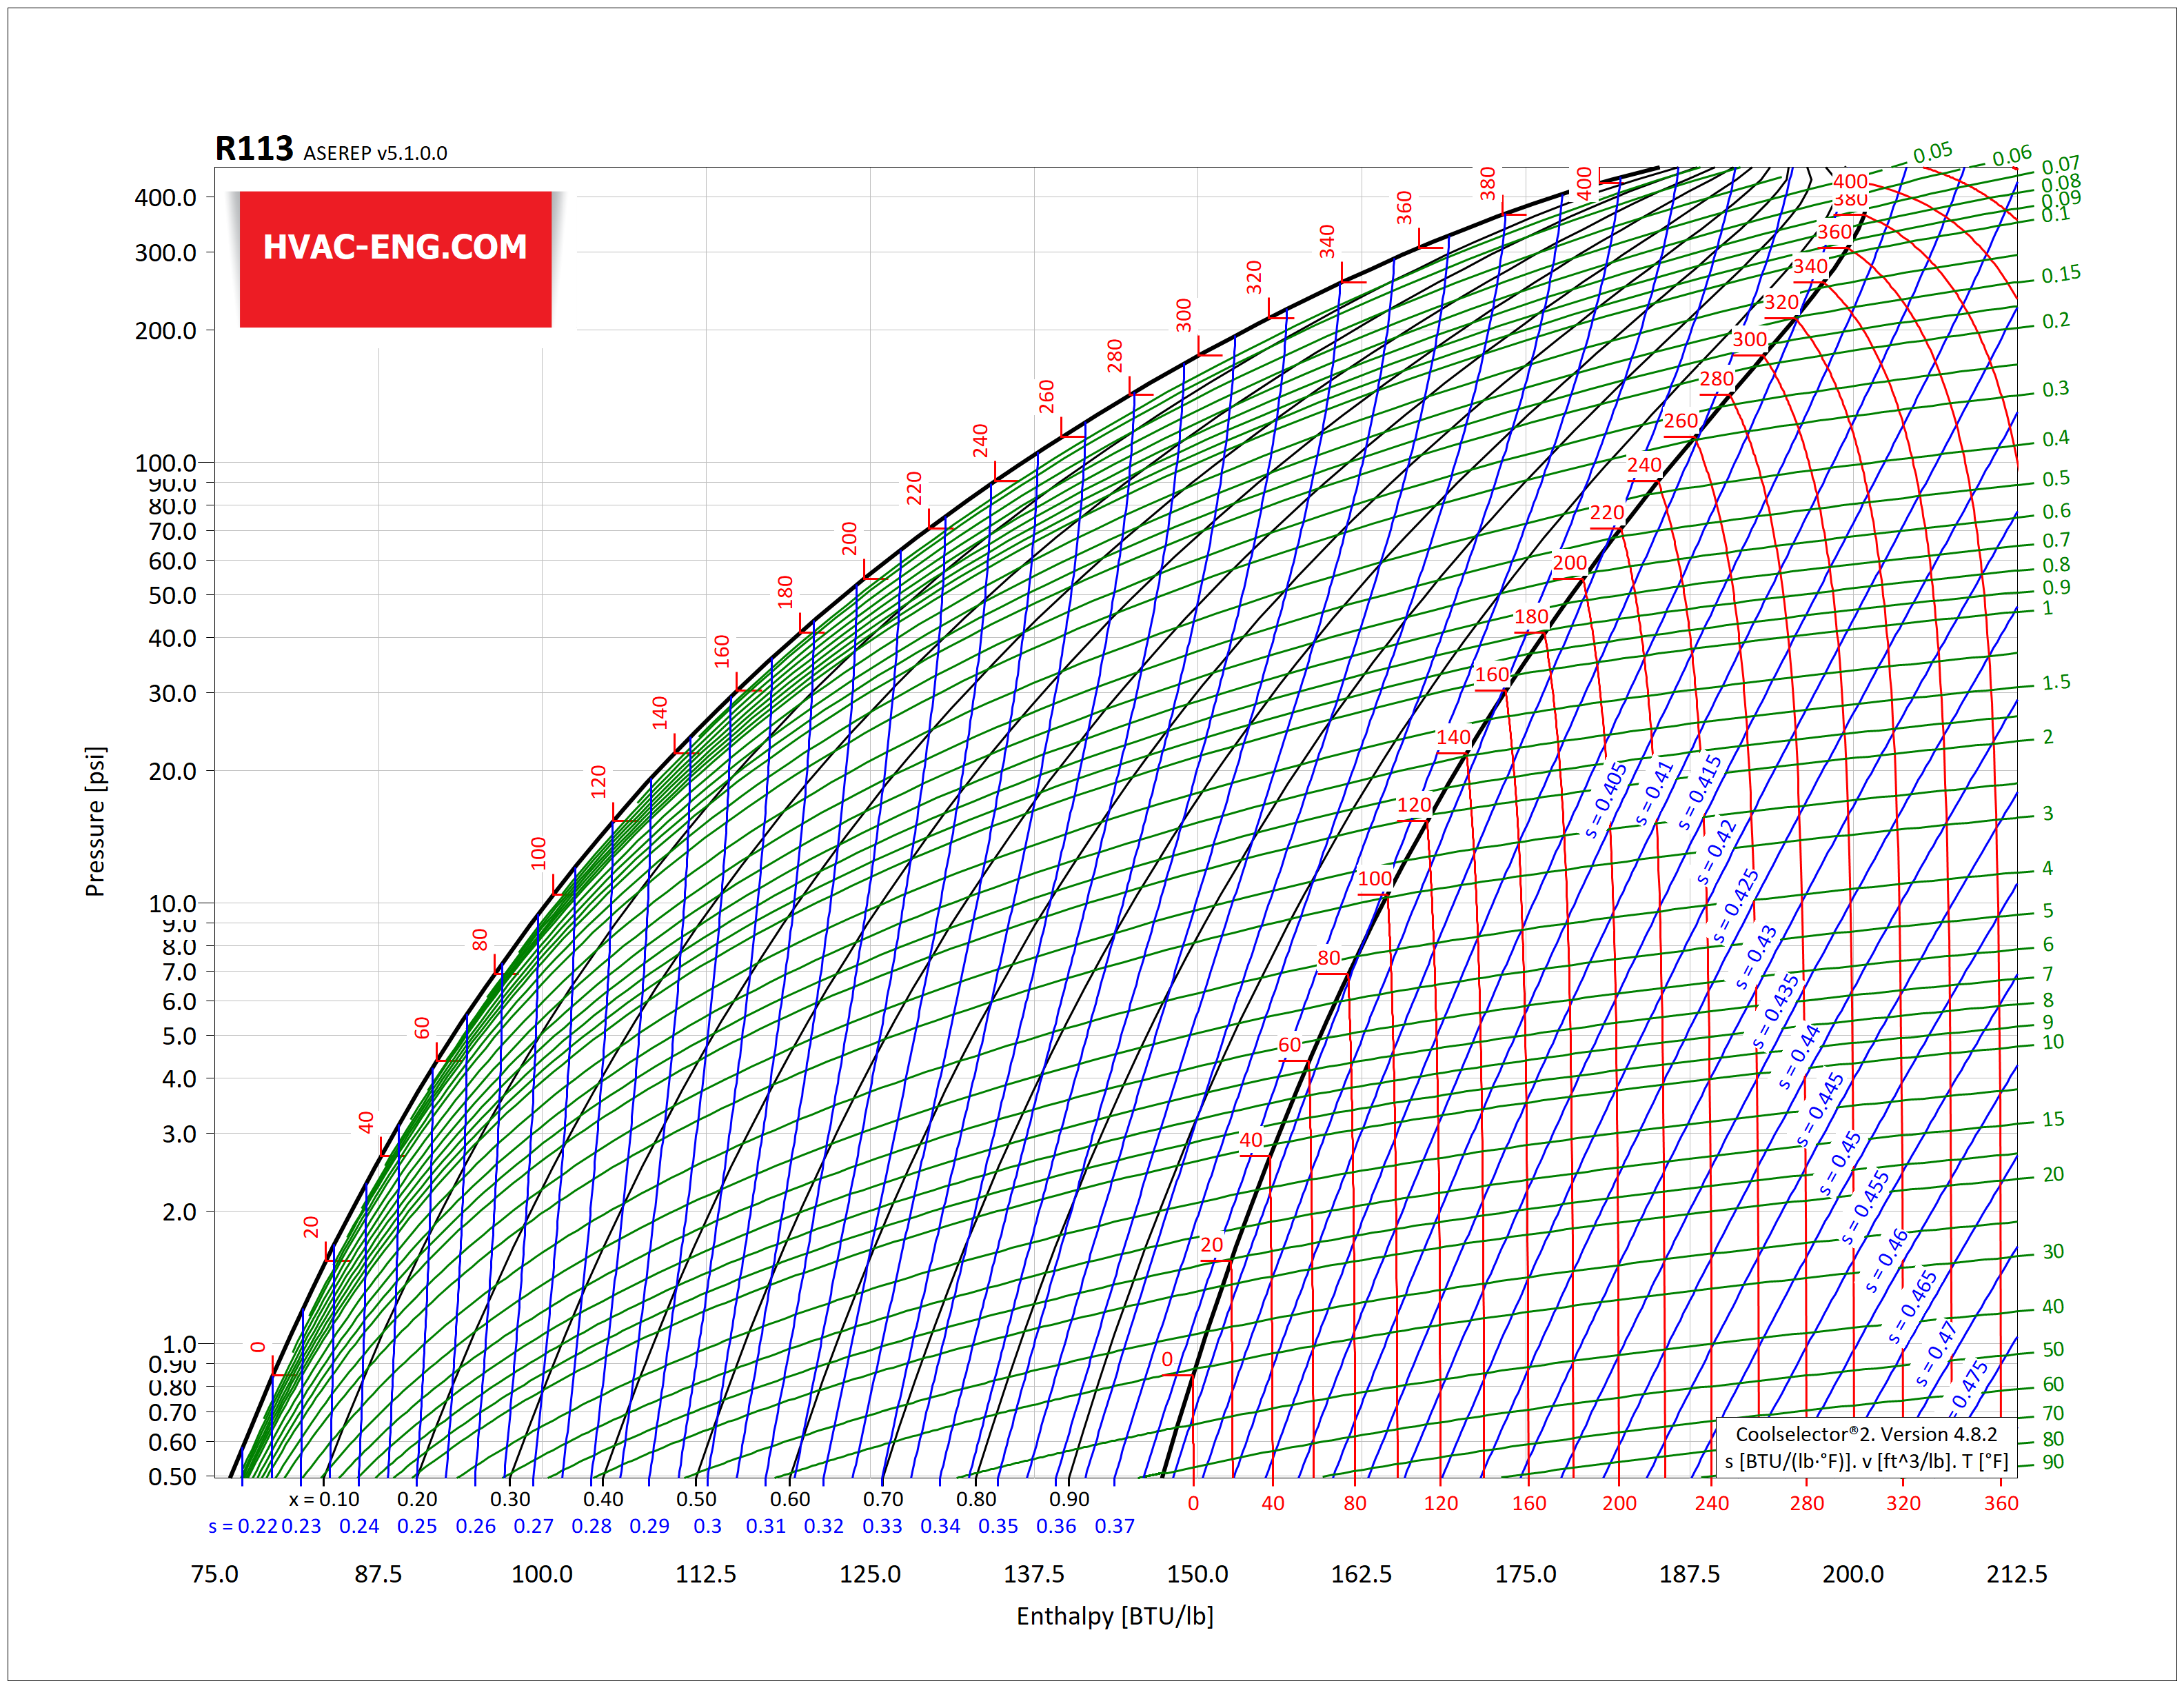
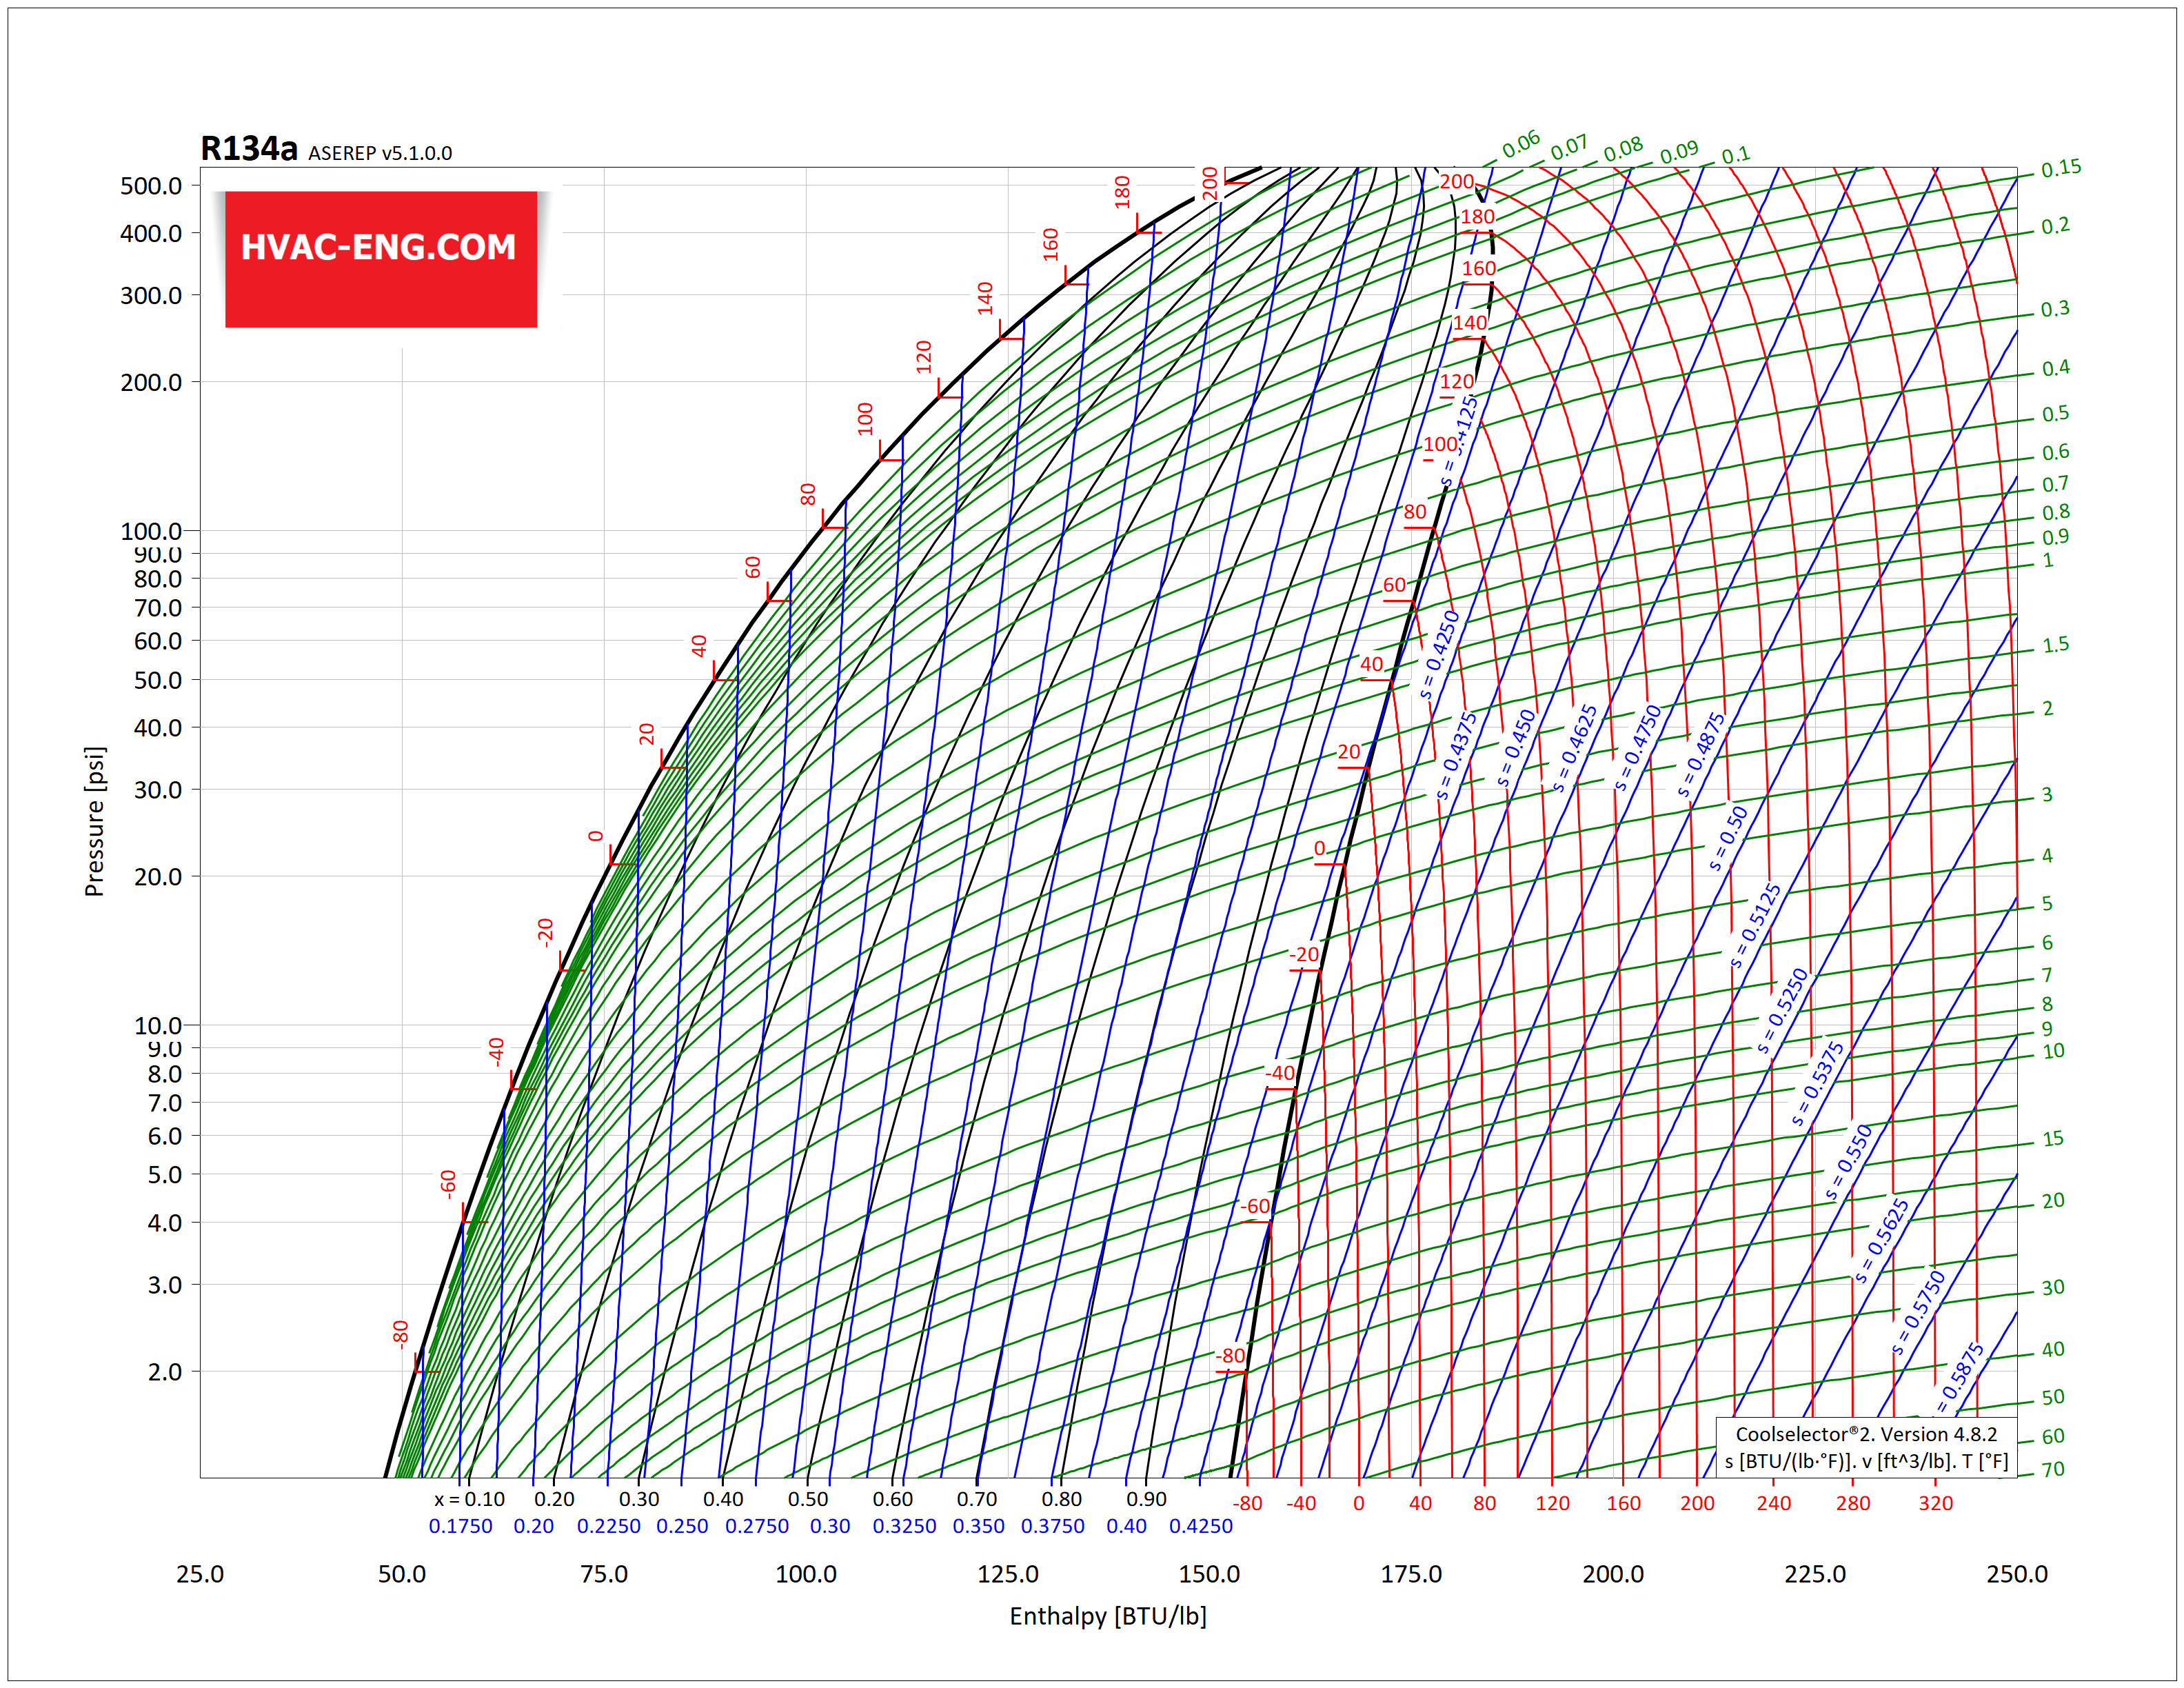
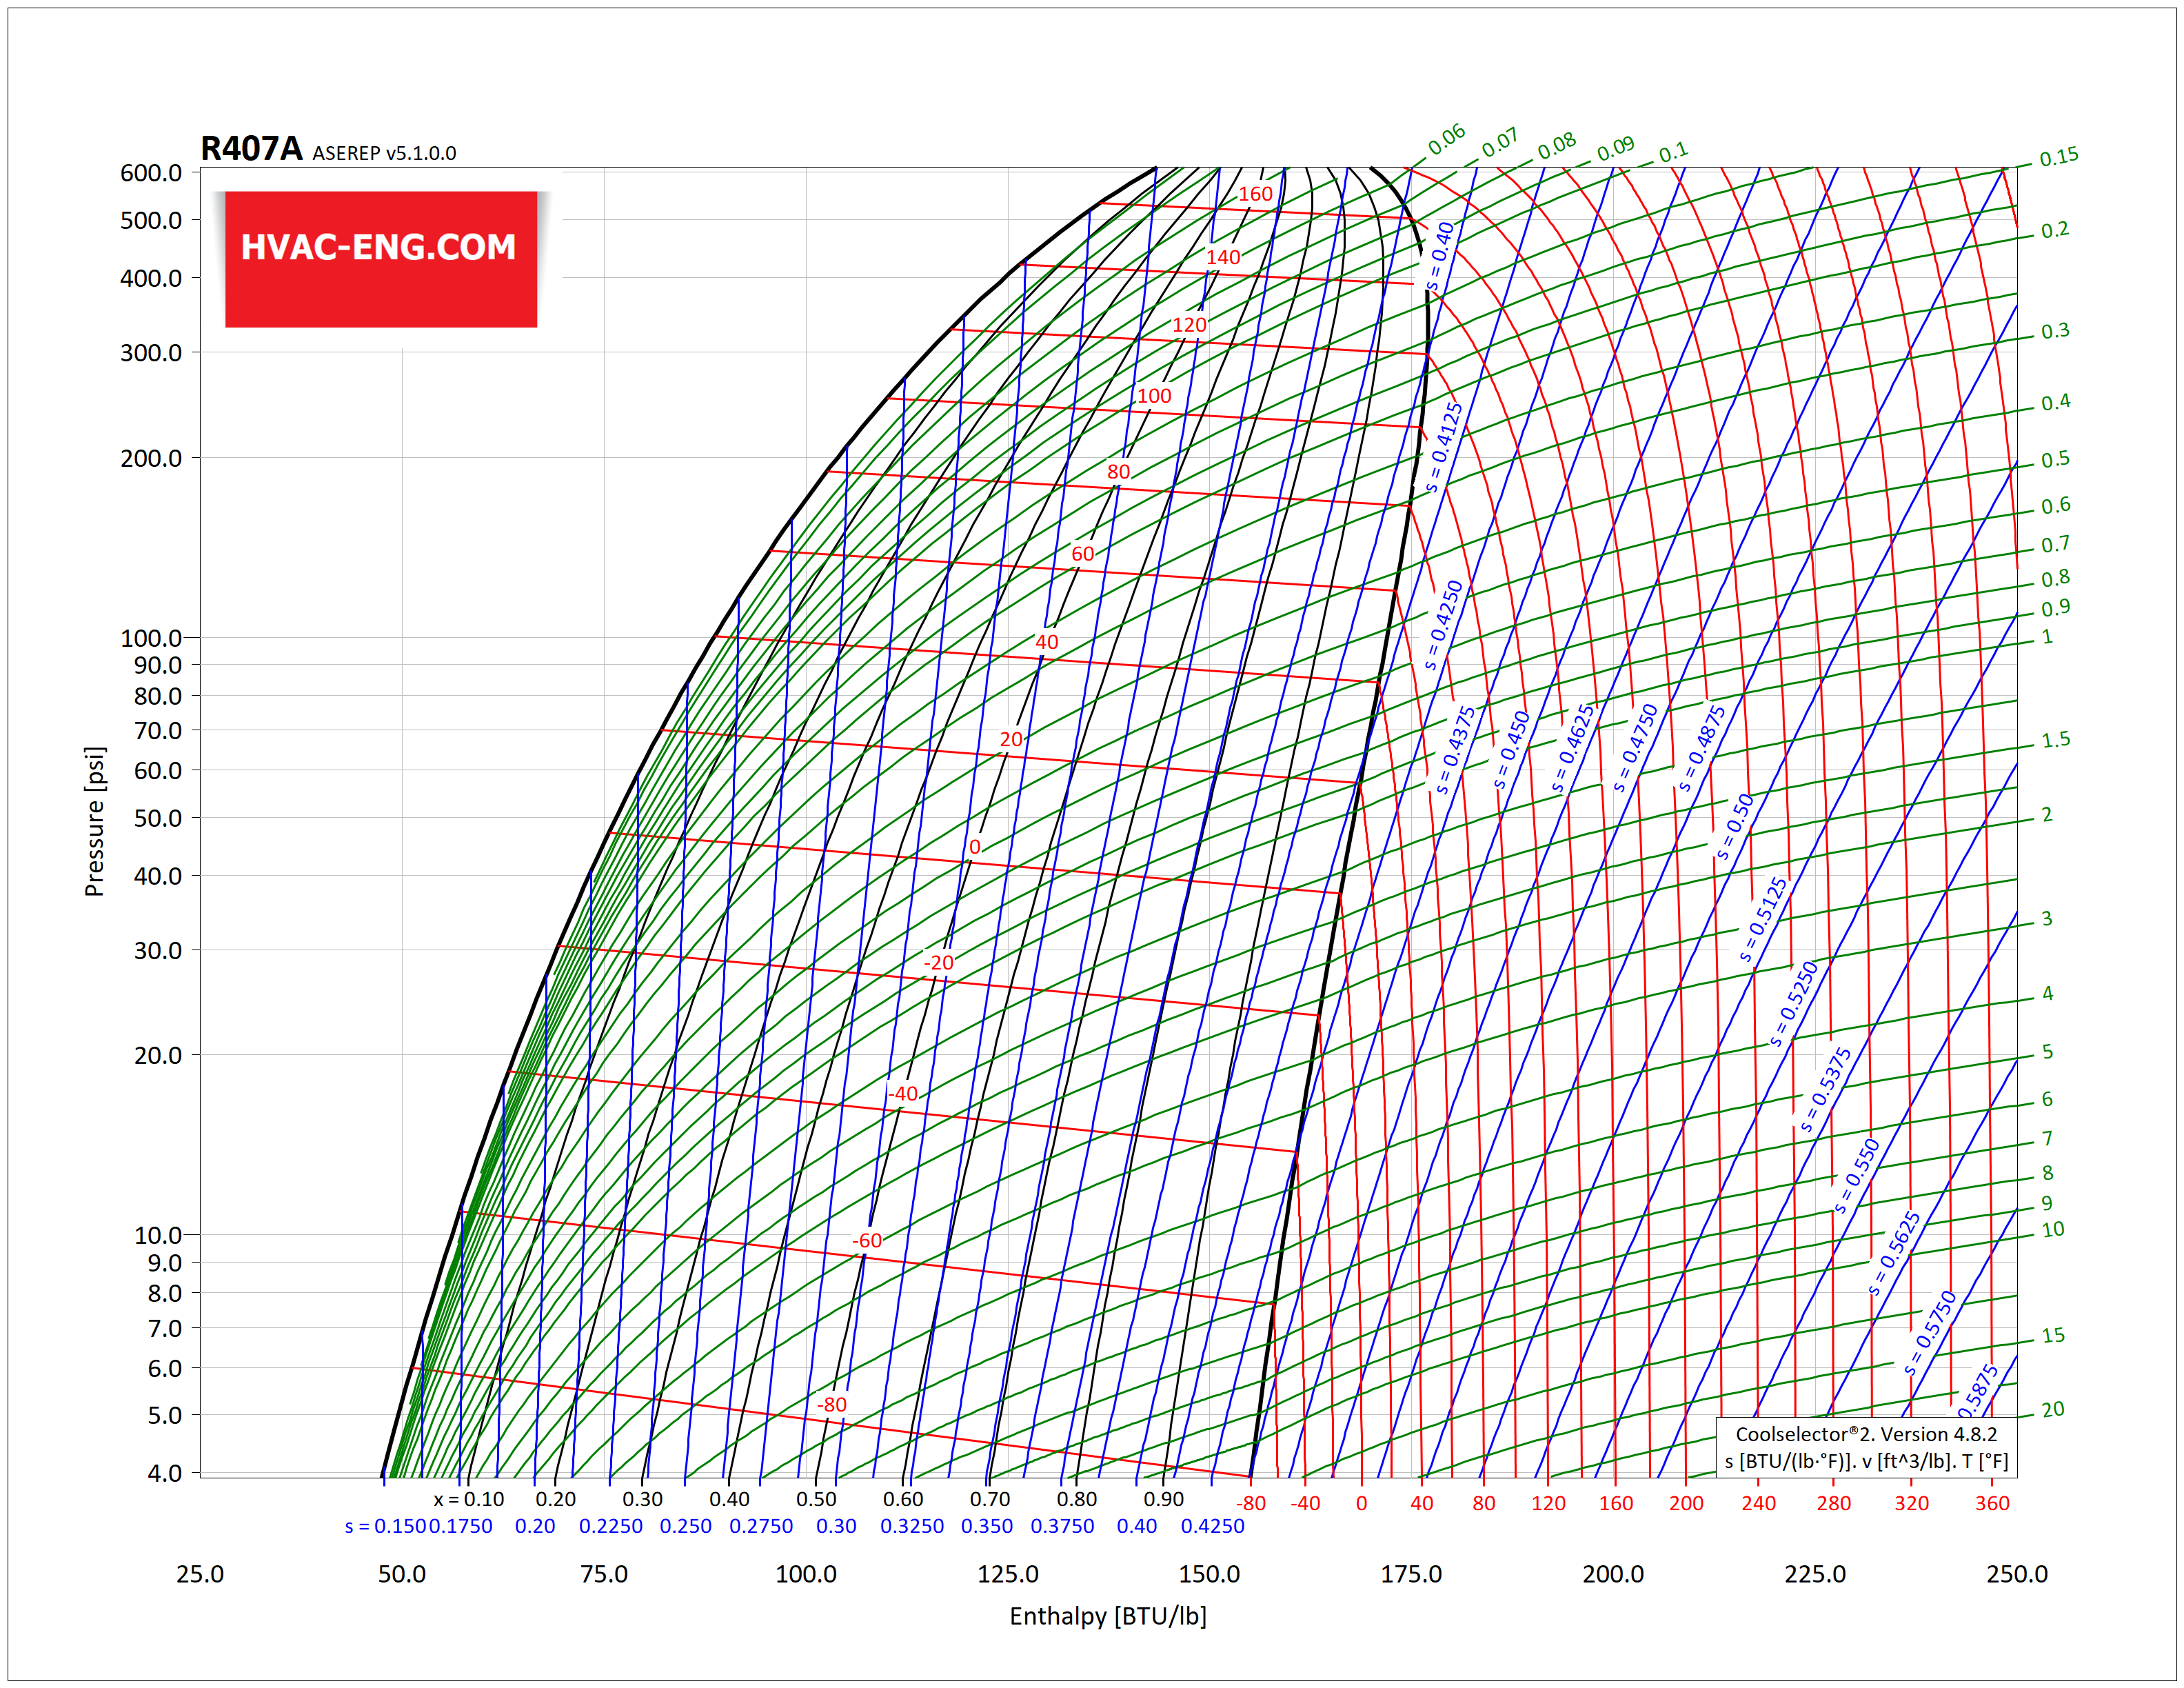
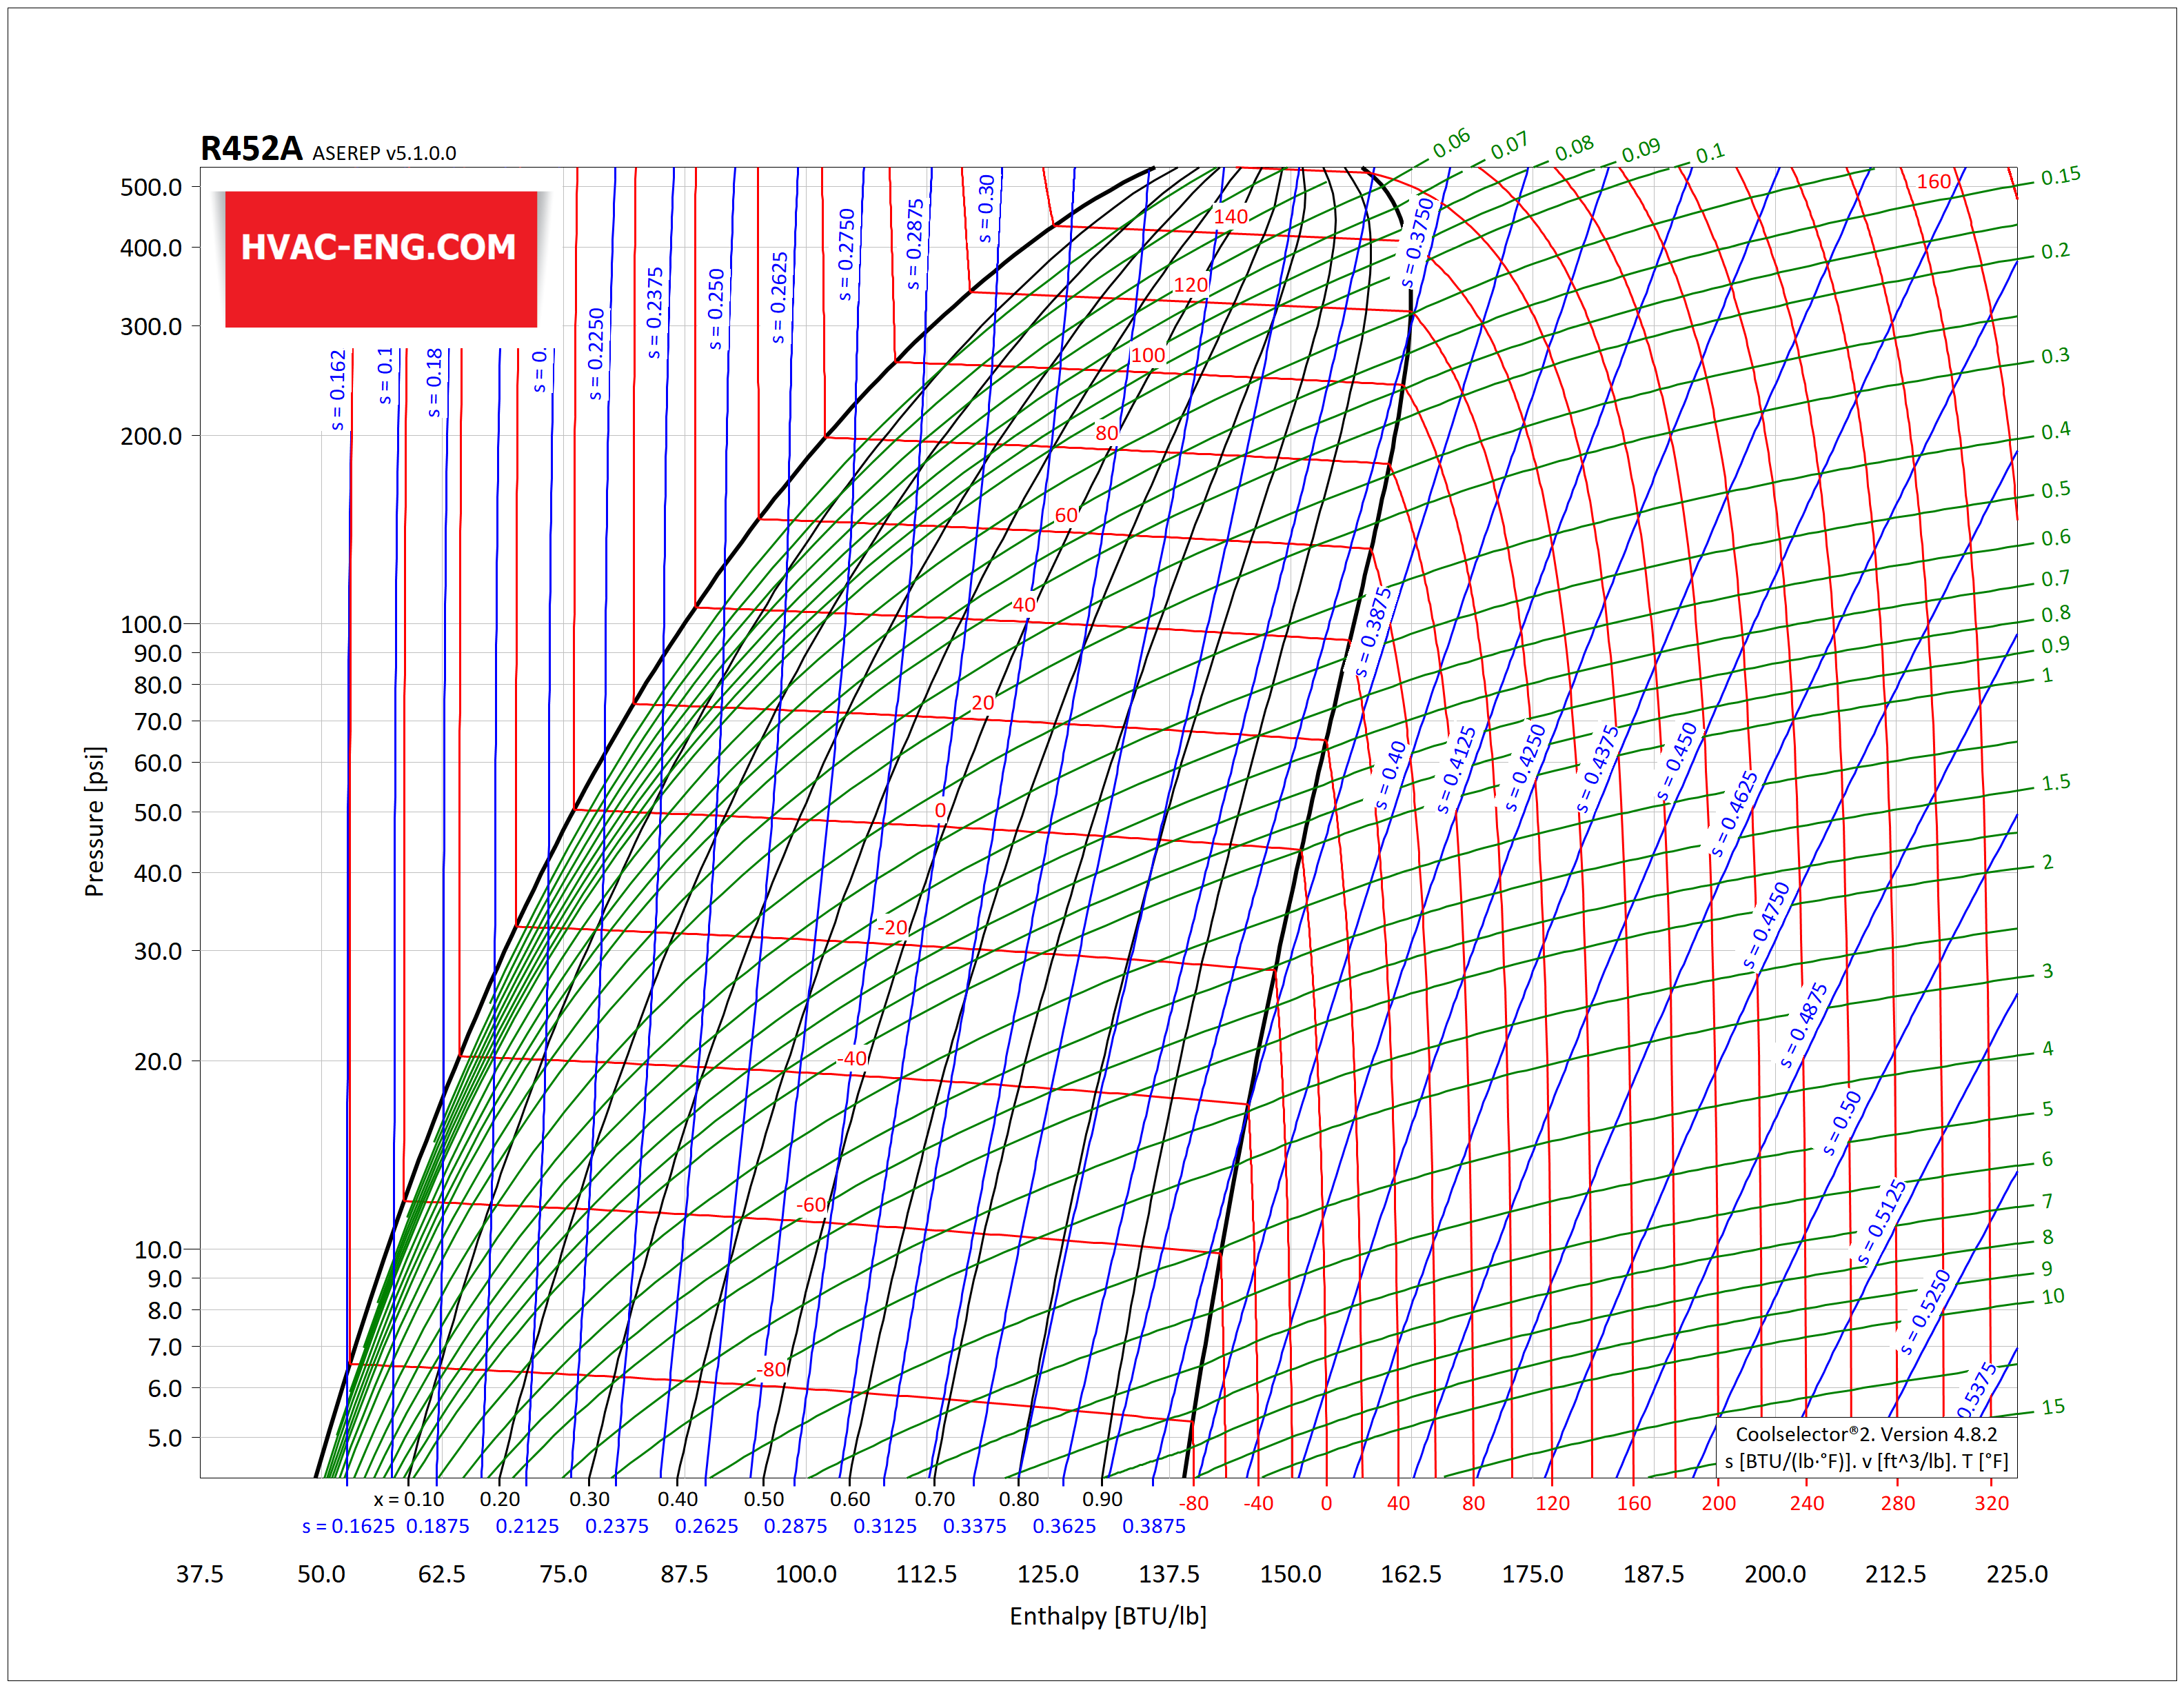
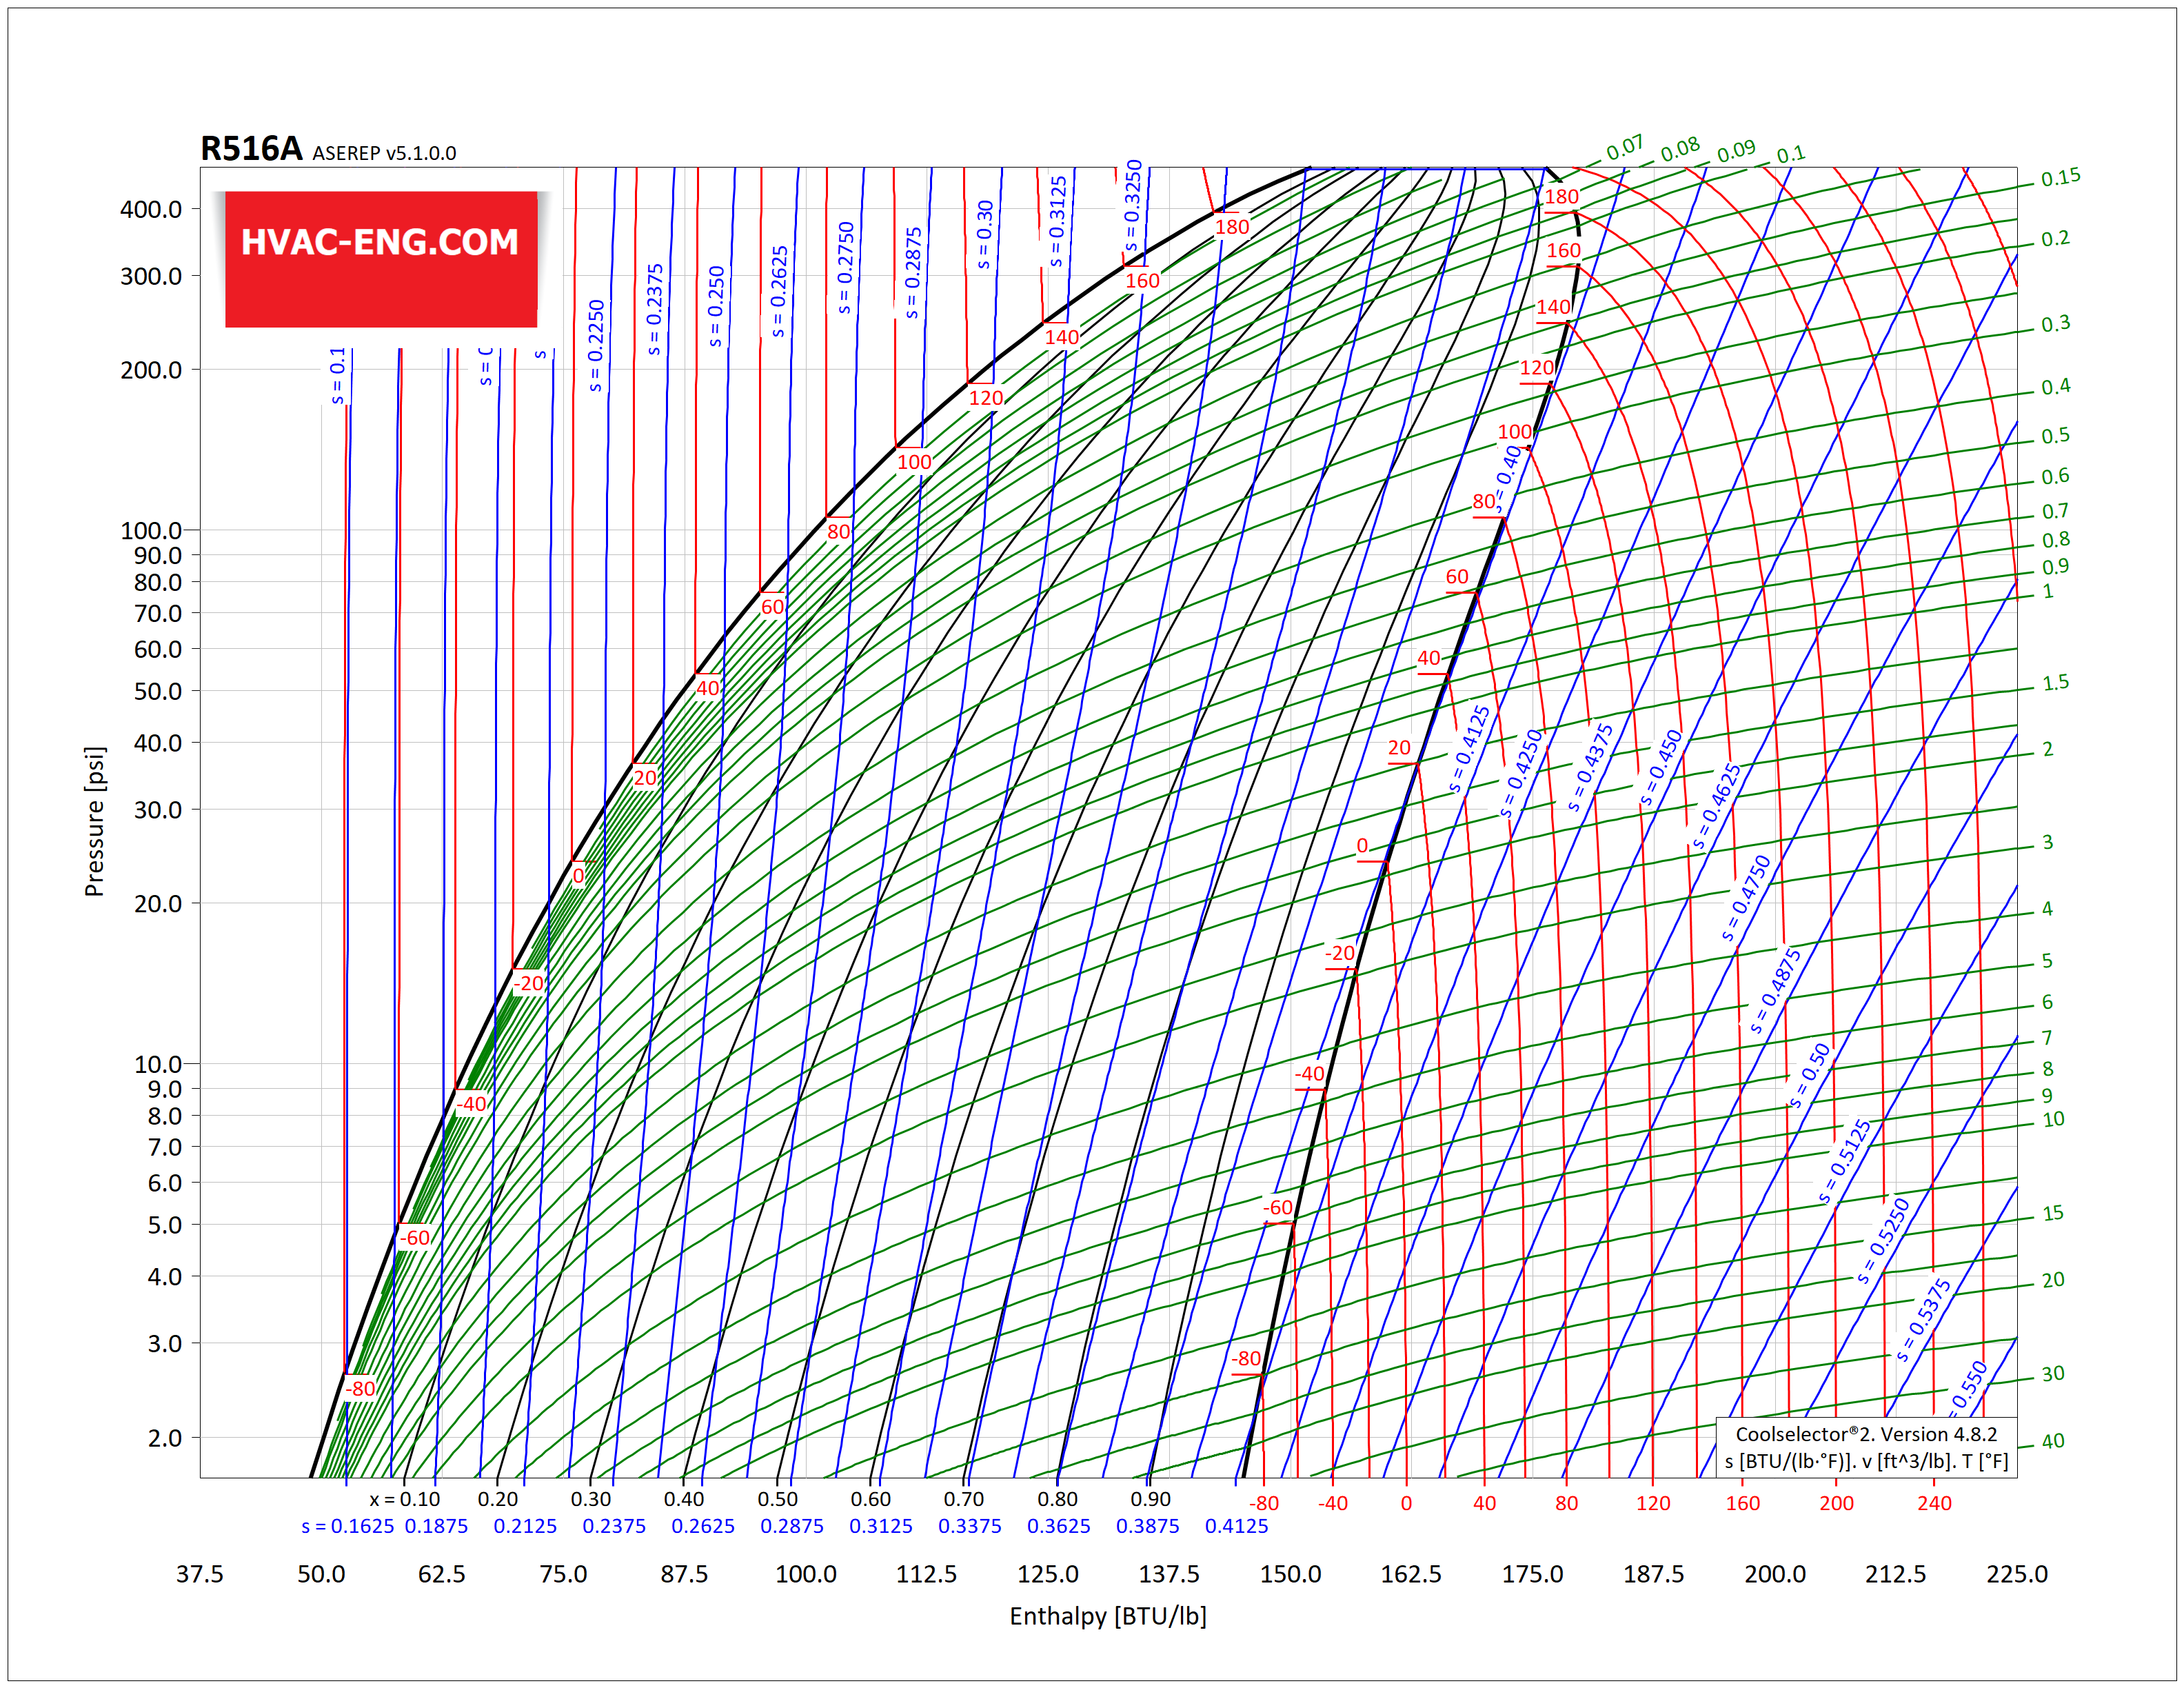
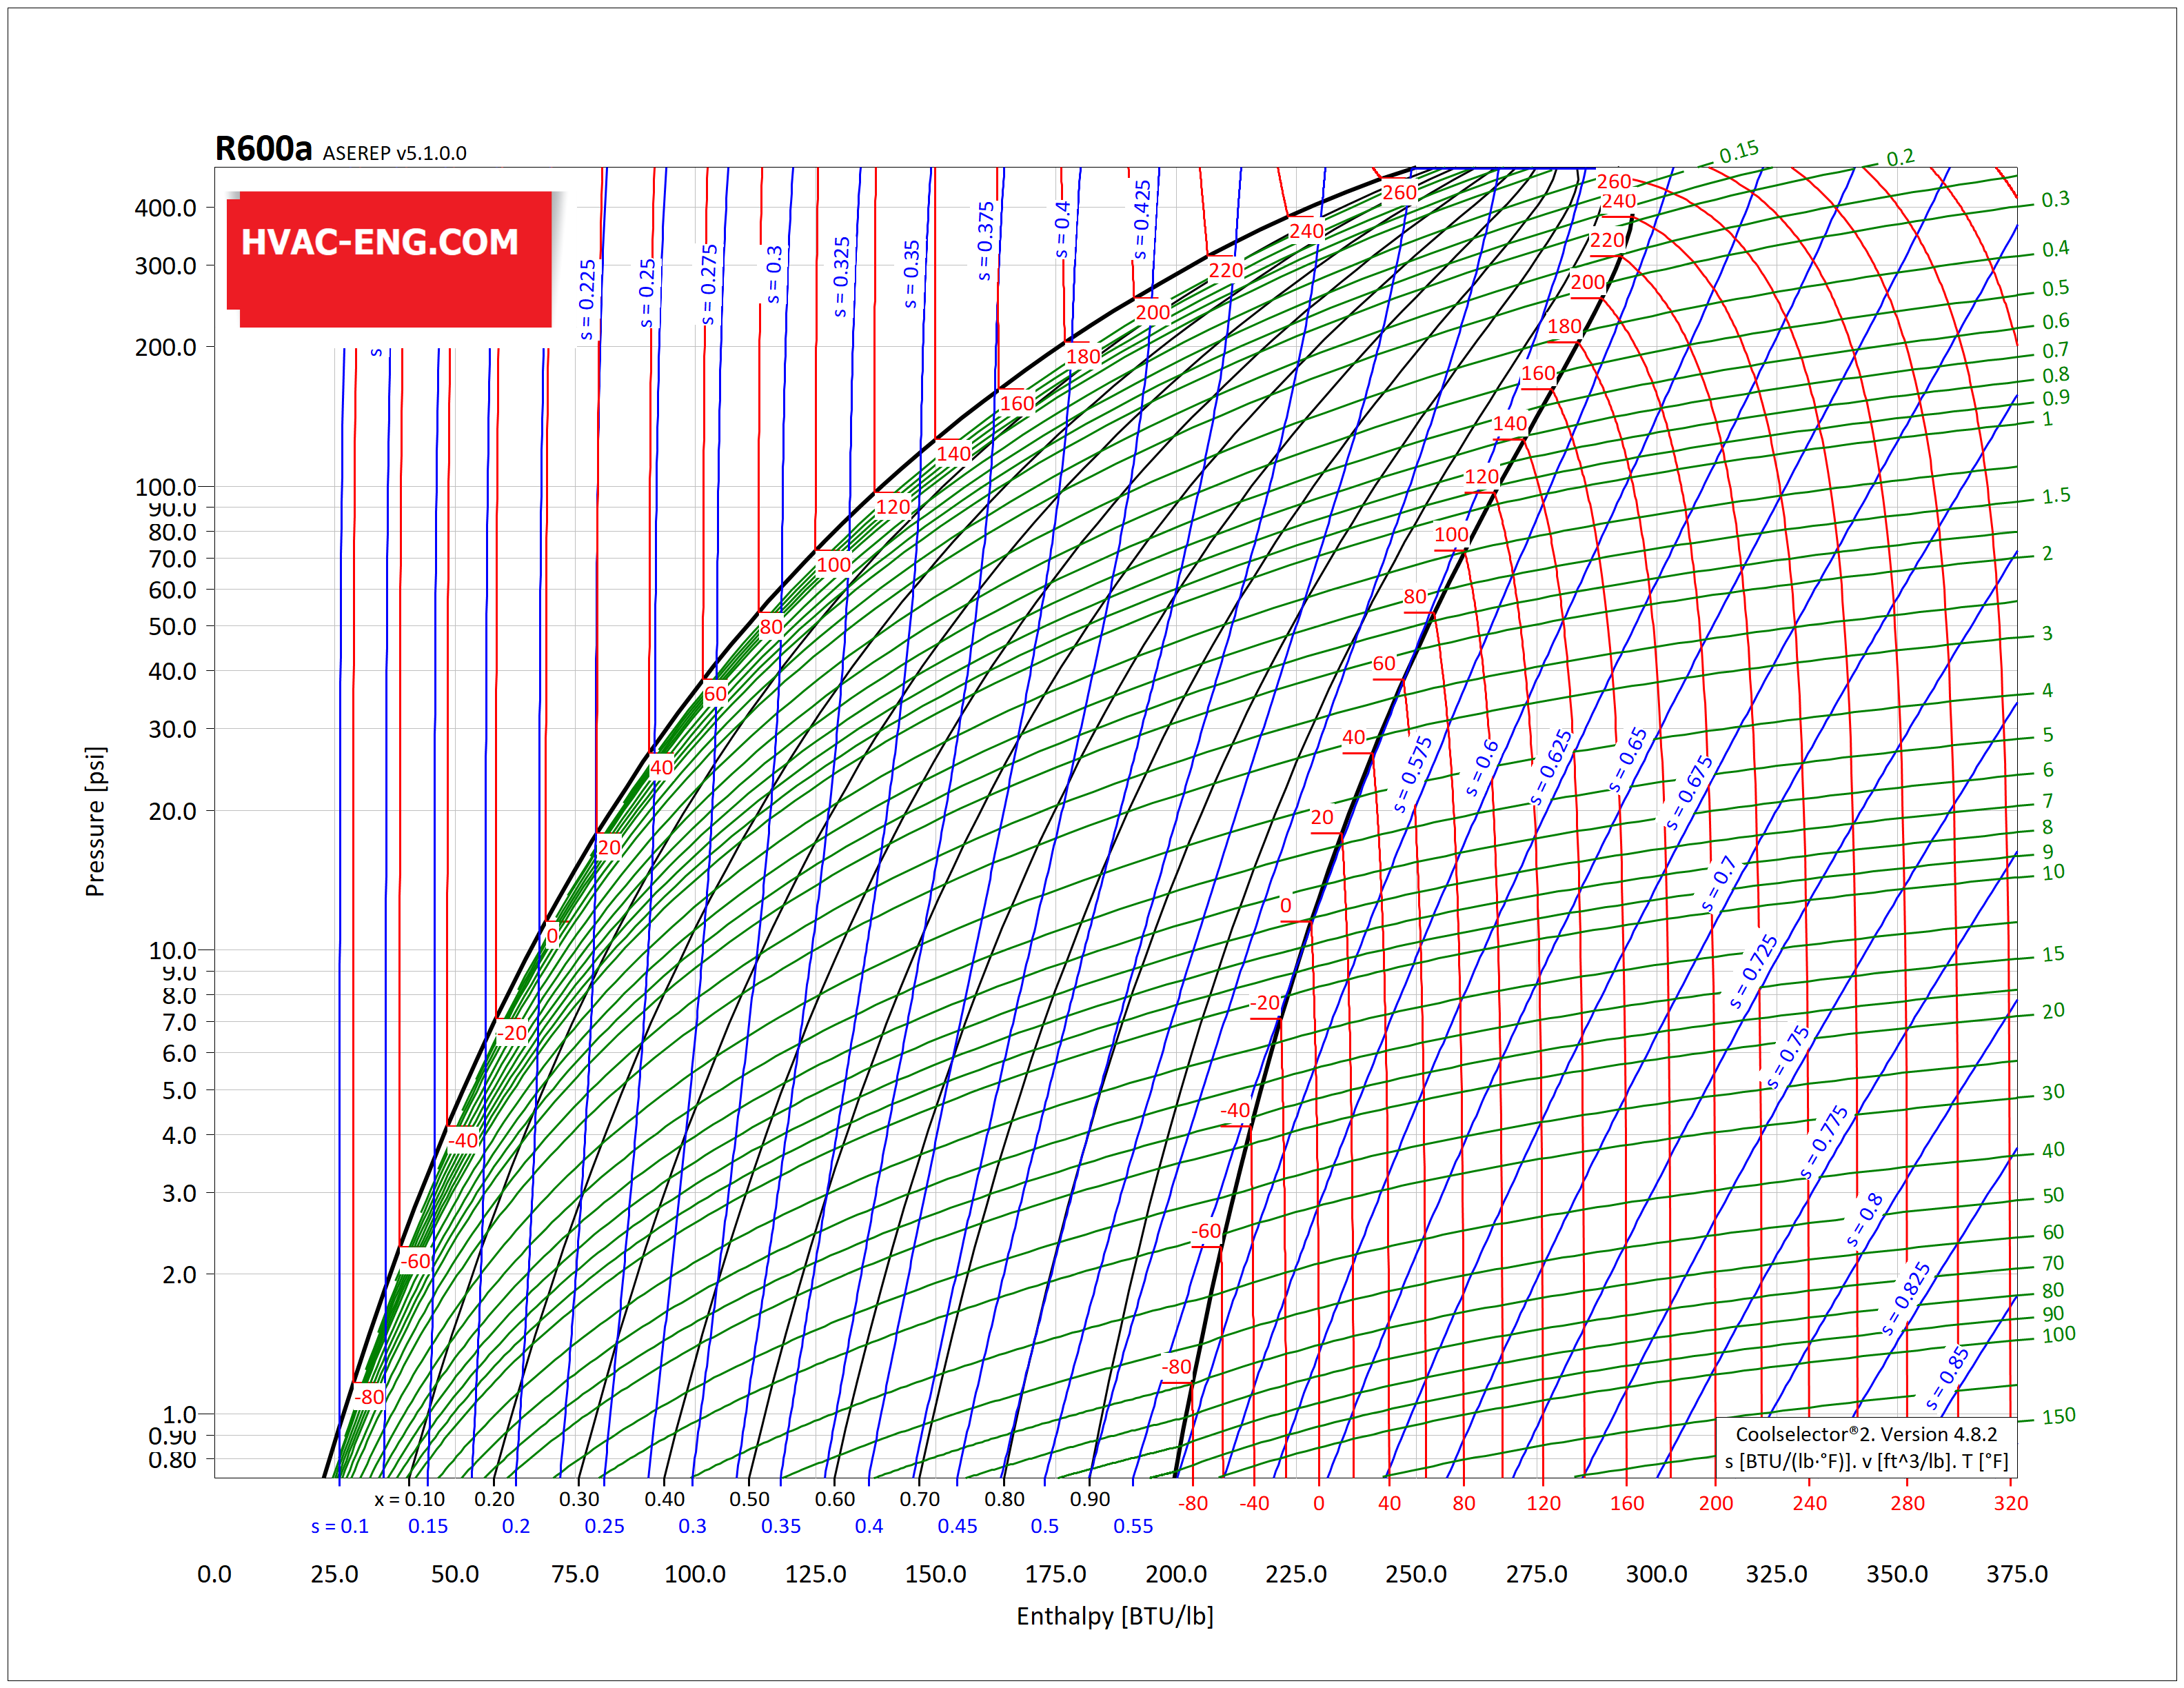
圧力エンタルピー線図は、熱と仕事の伝達と冷凍サイクルのパフォーマンスを分析および計算するための最も一般的なグラフィック ツールです。 圧力の変化はph線図で明確に示すことができます。 また、さまざまなプロセスの熱と仕事の移動はエンタルピーの変化として計算でき、ph 線図に簡単に表示できます。
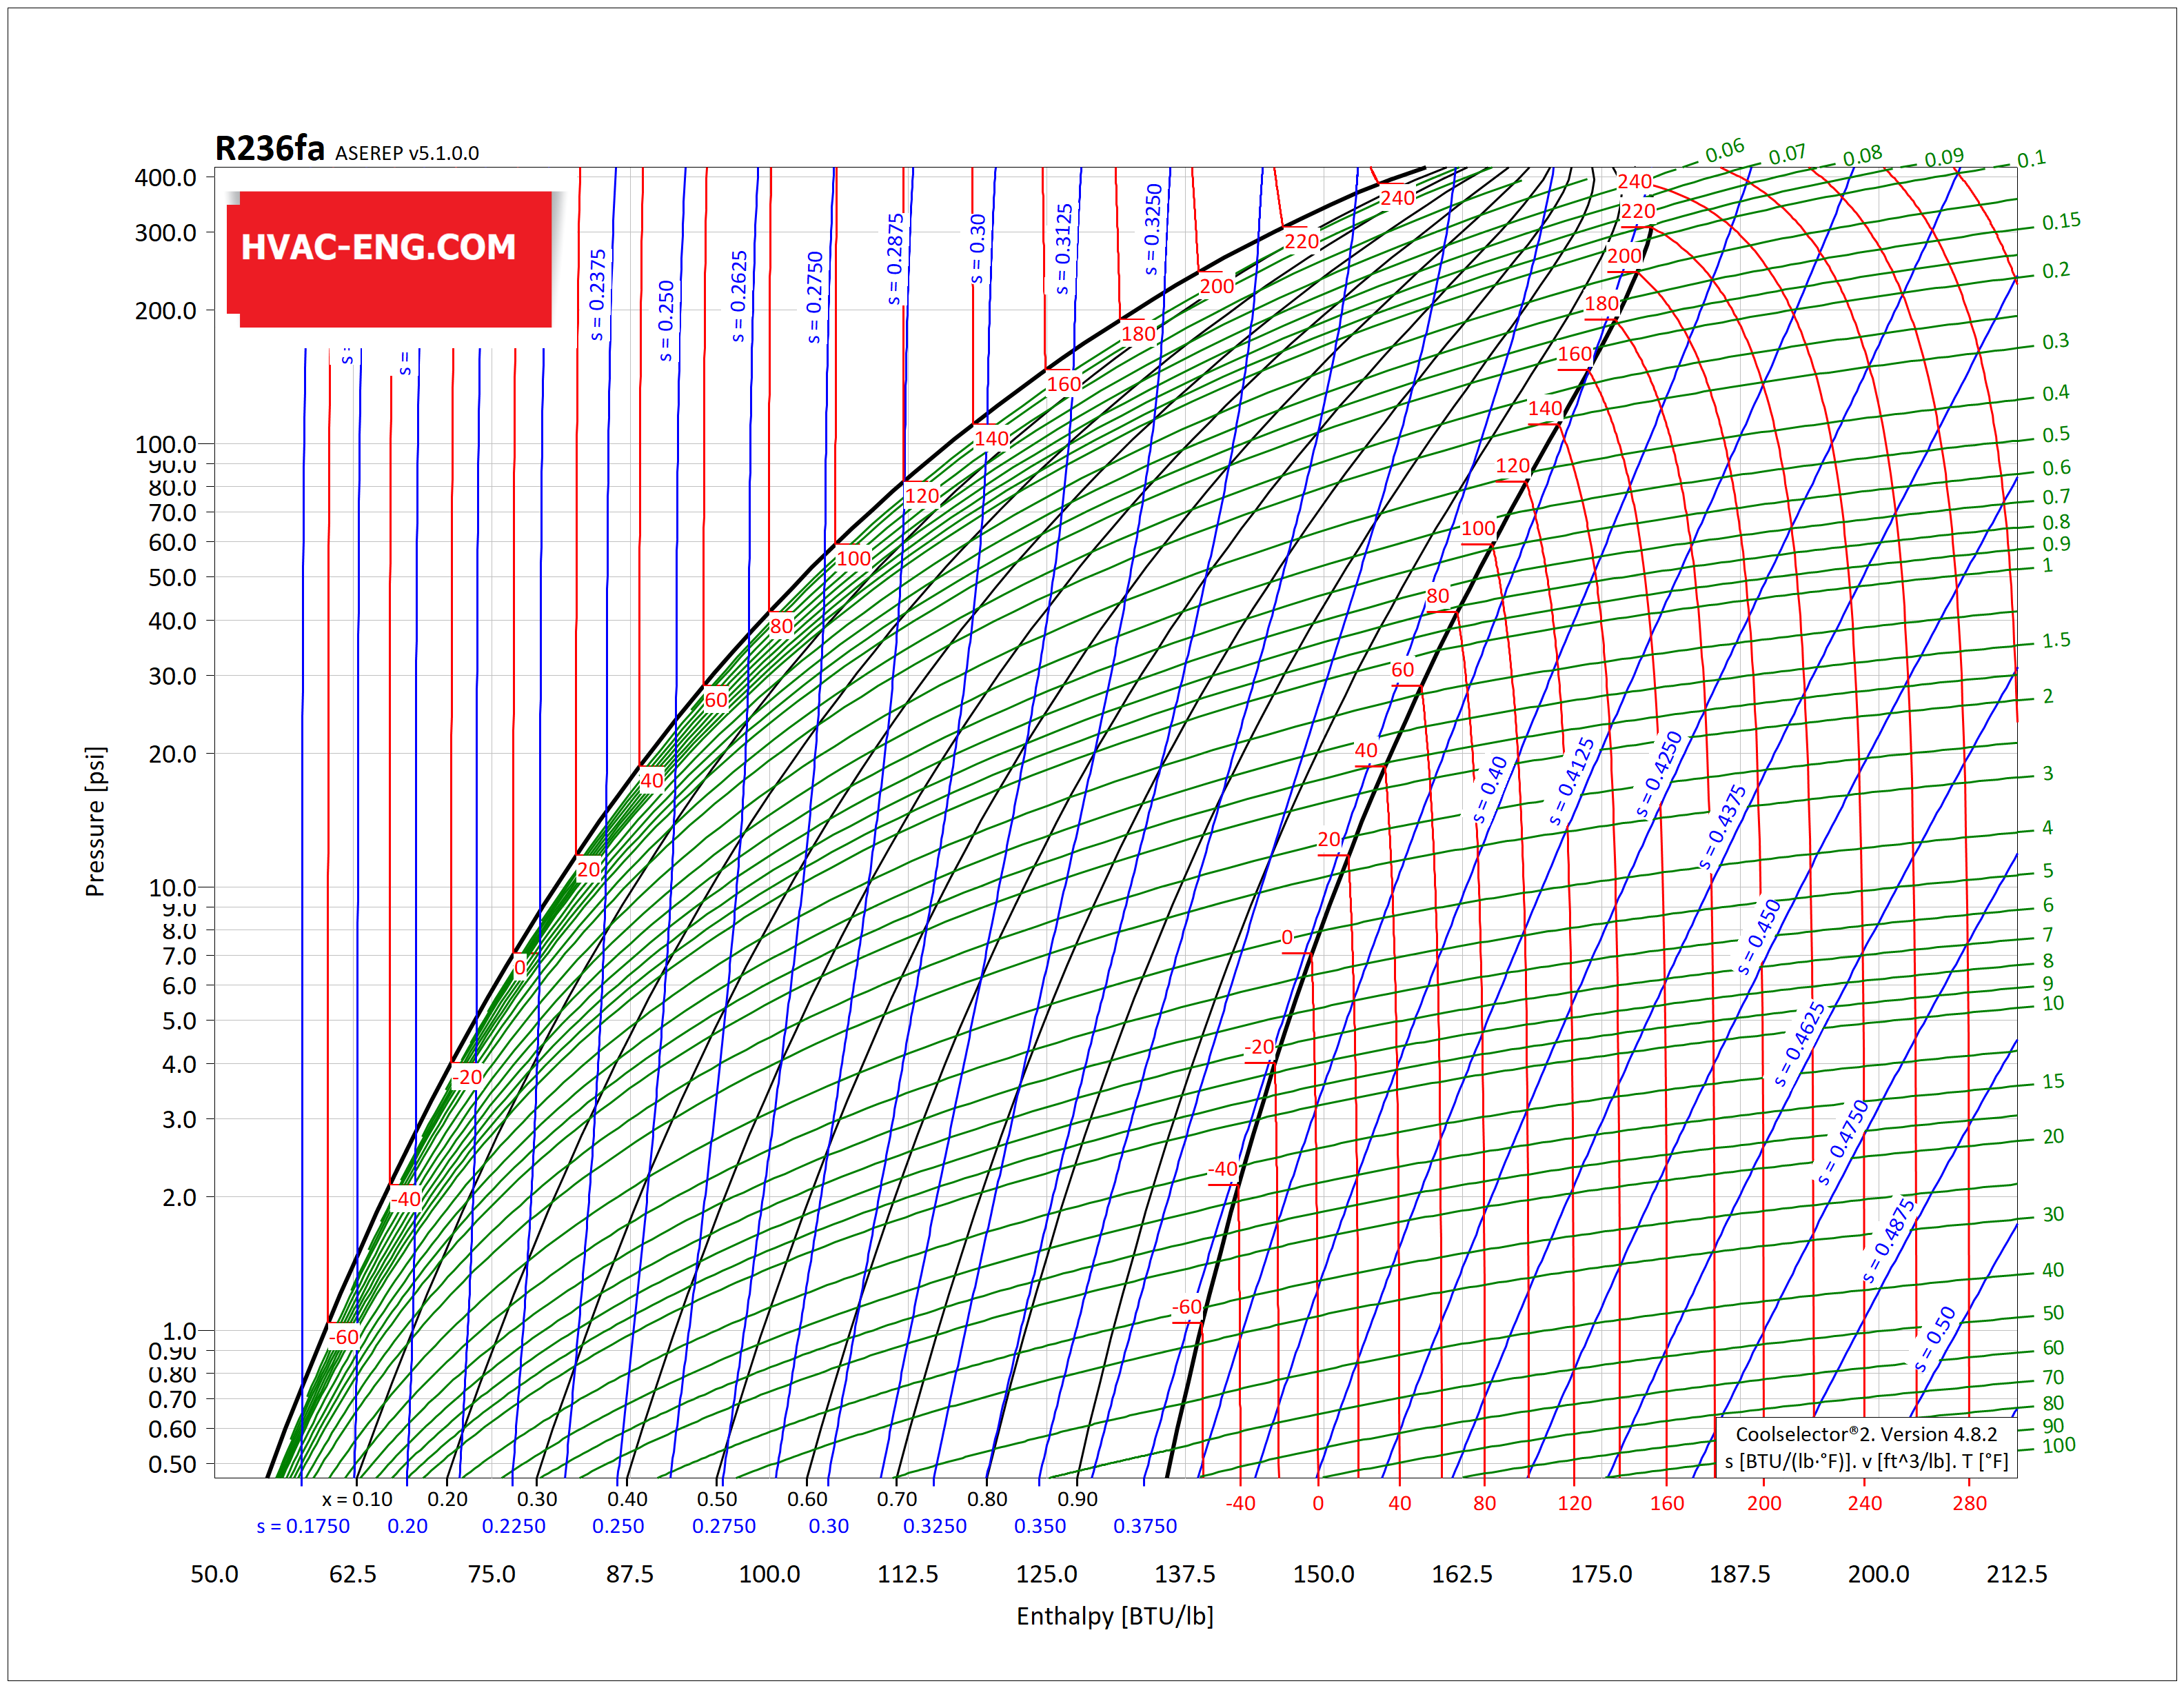
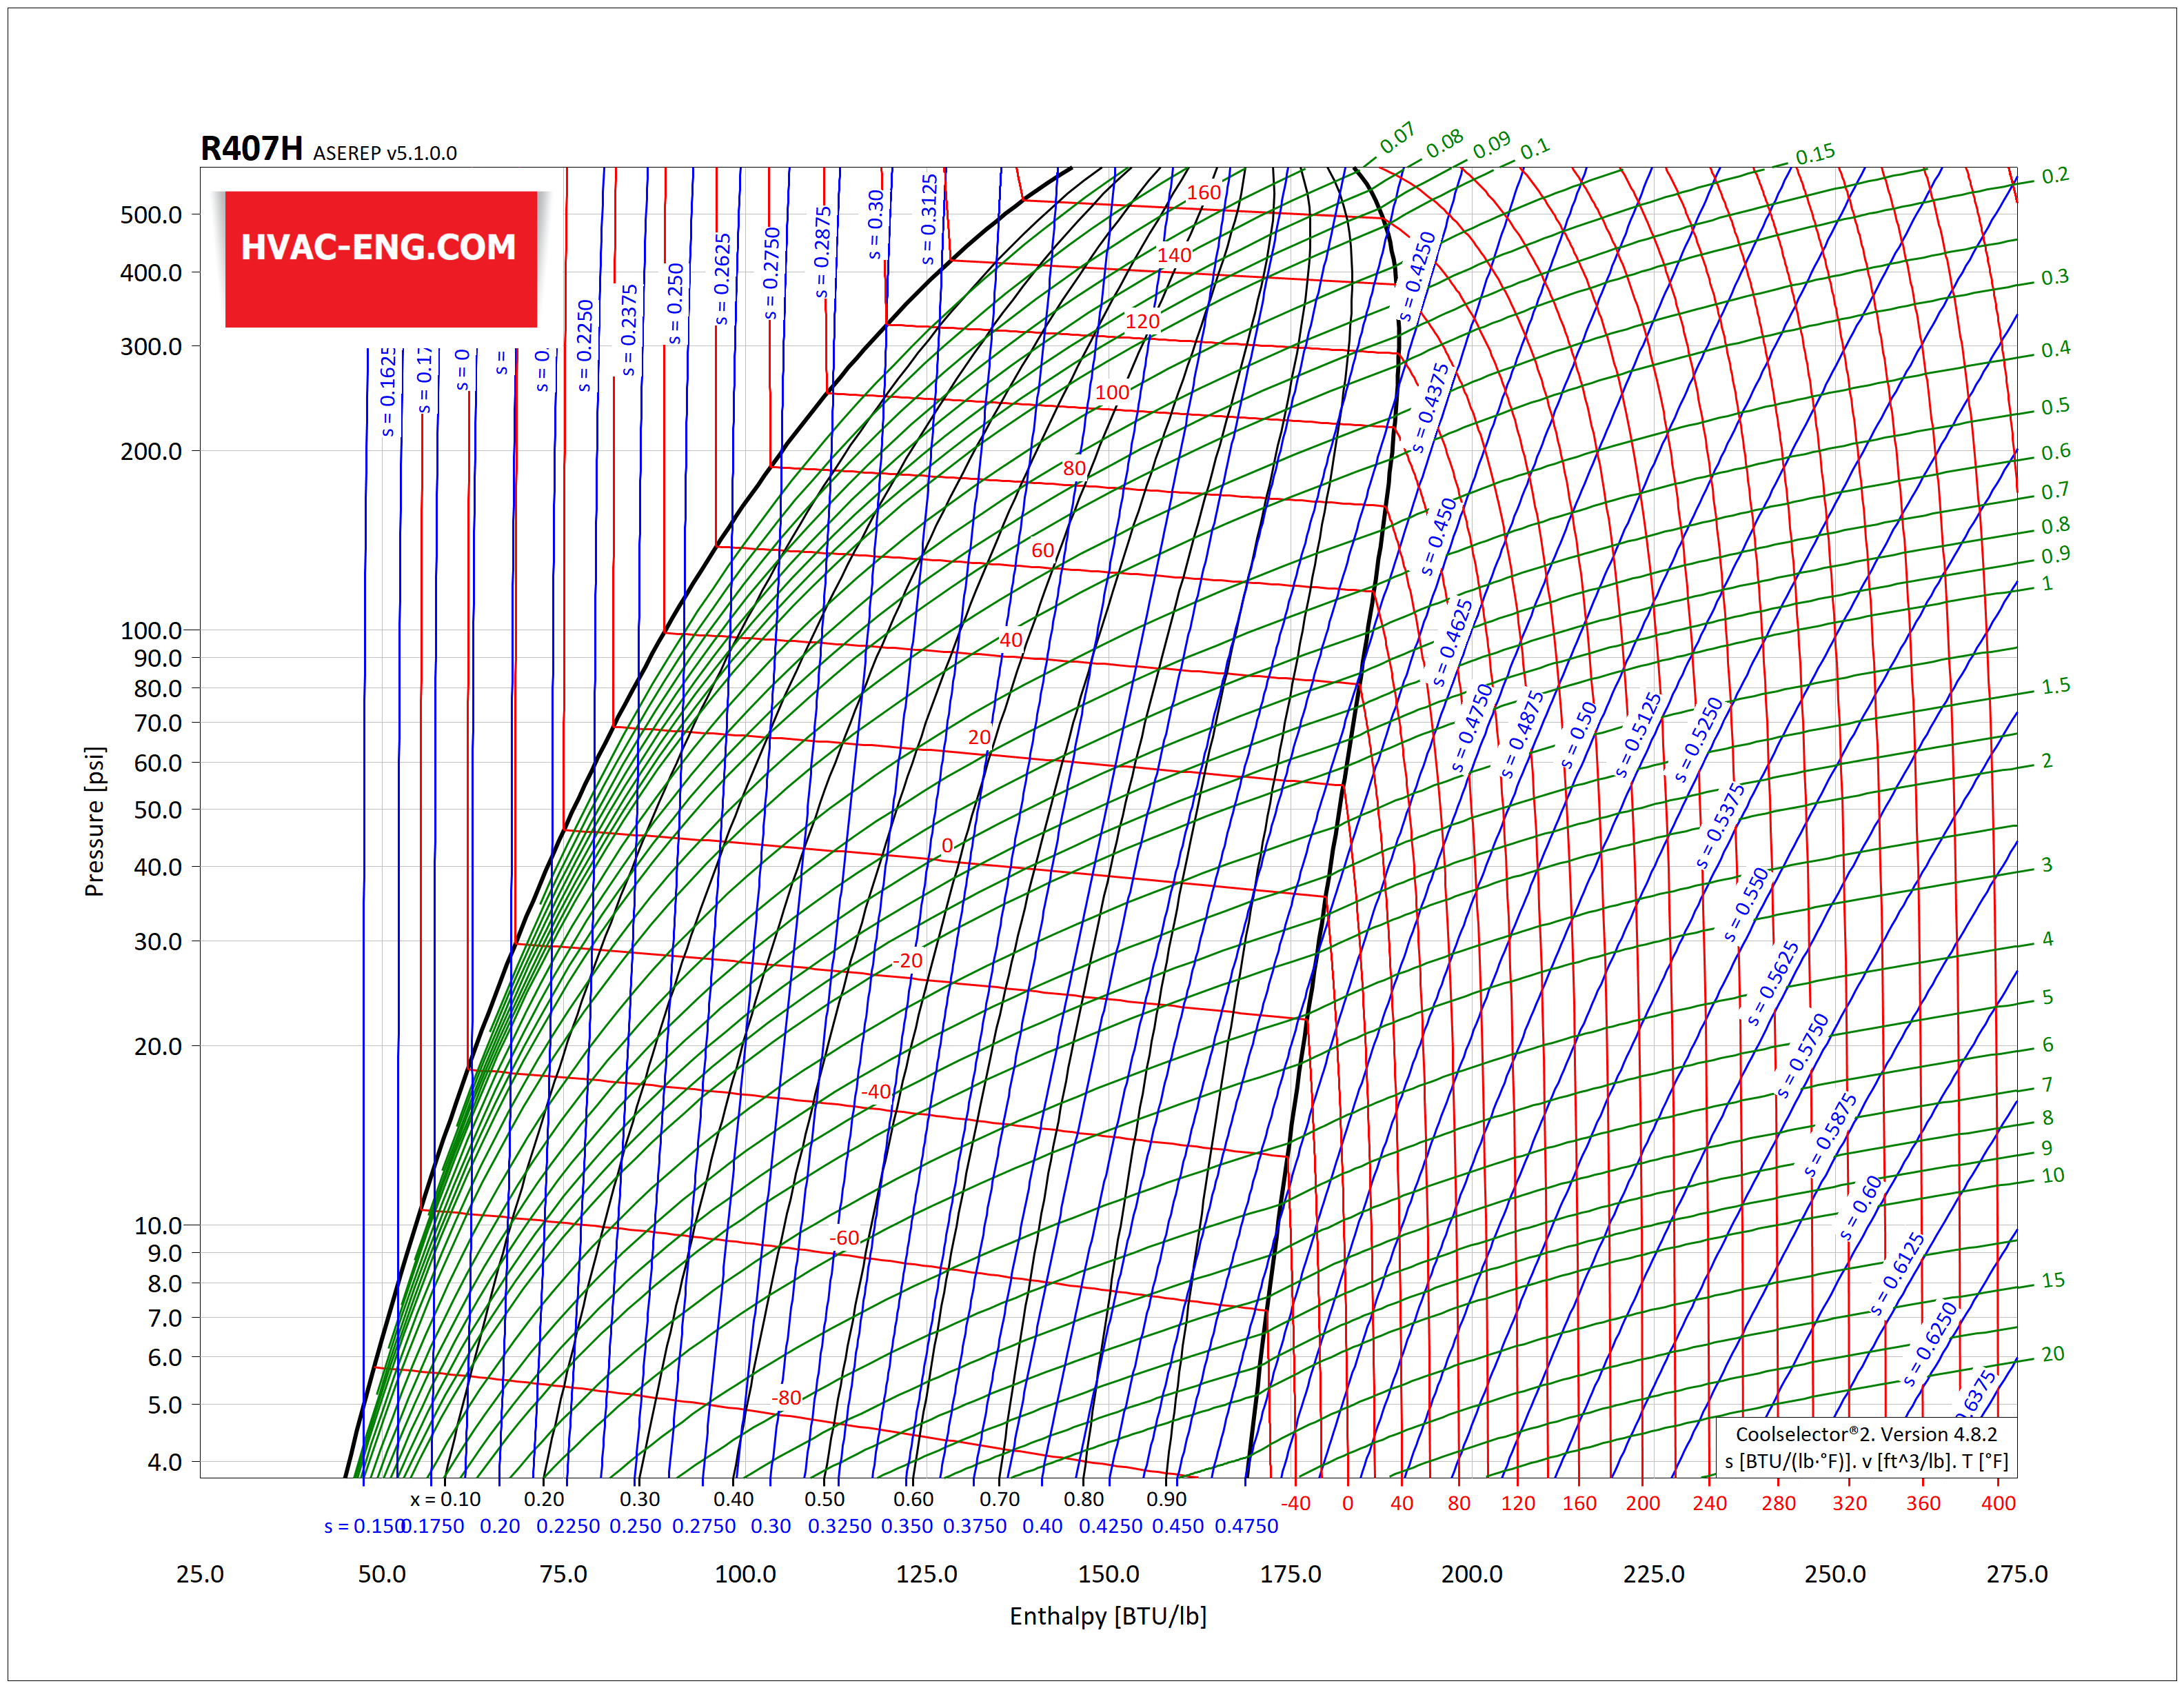
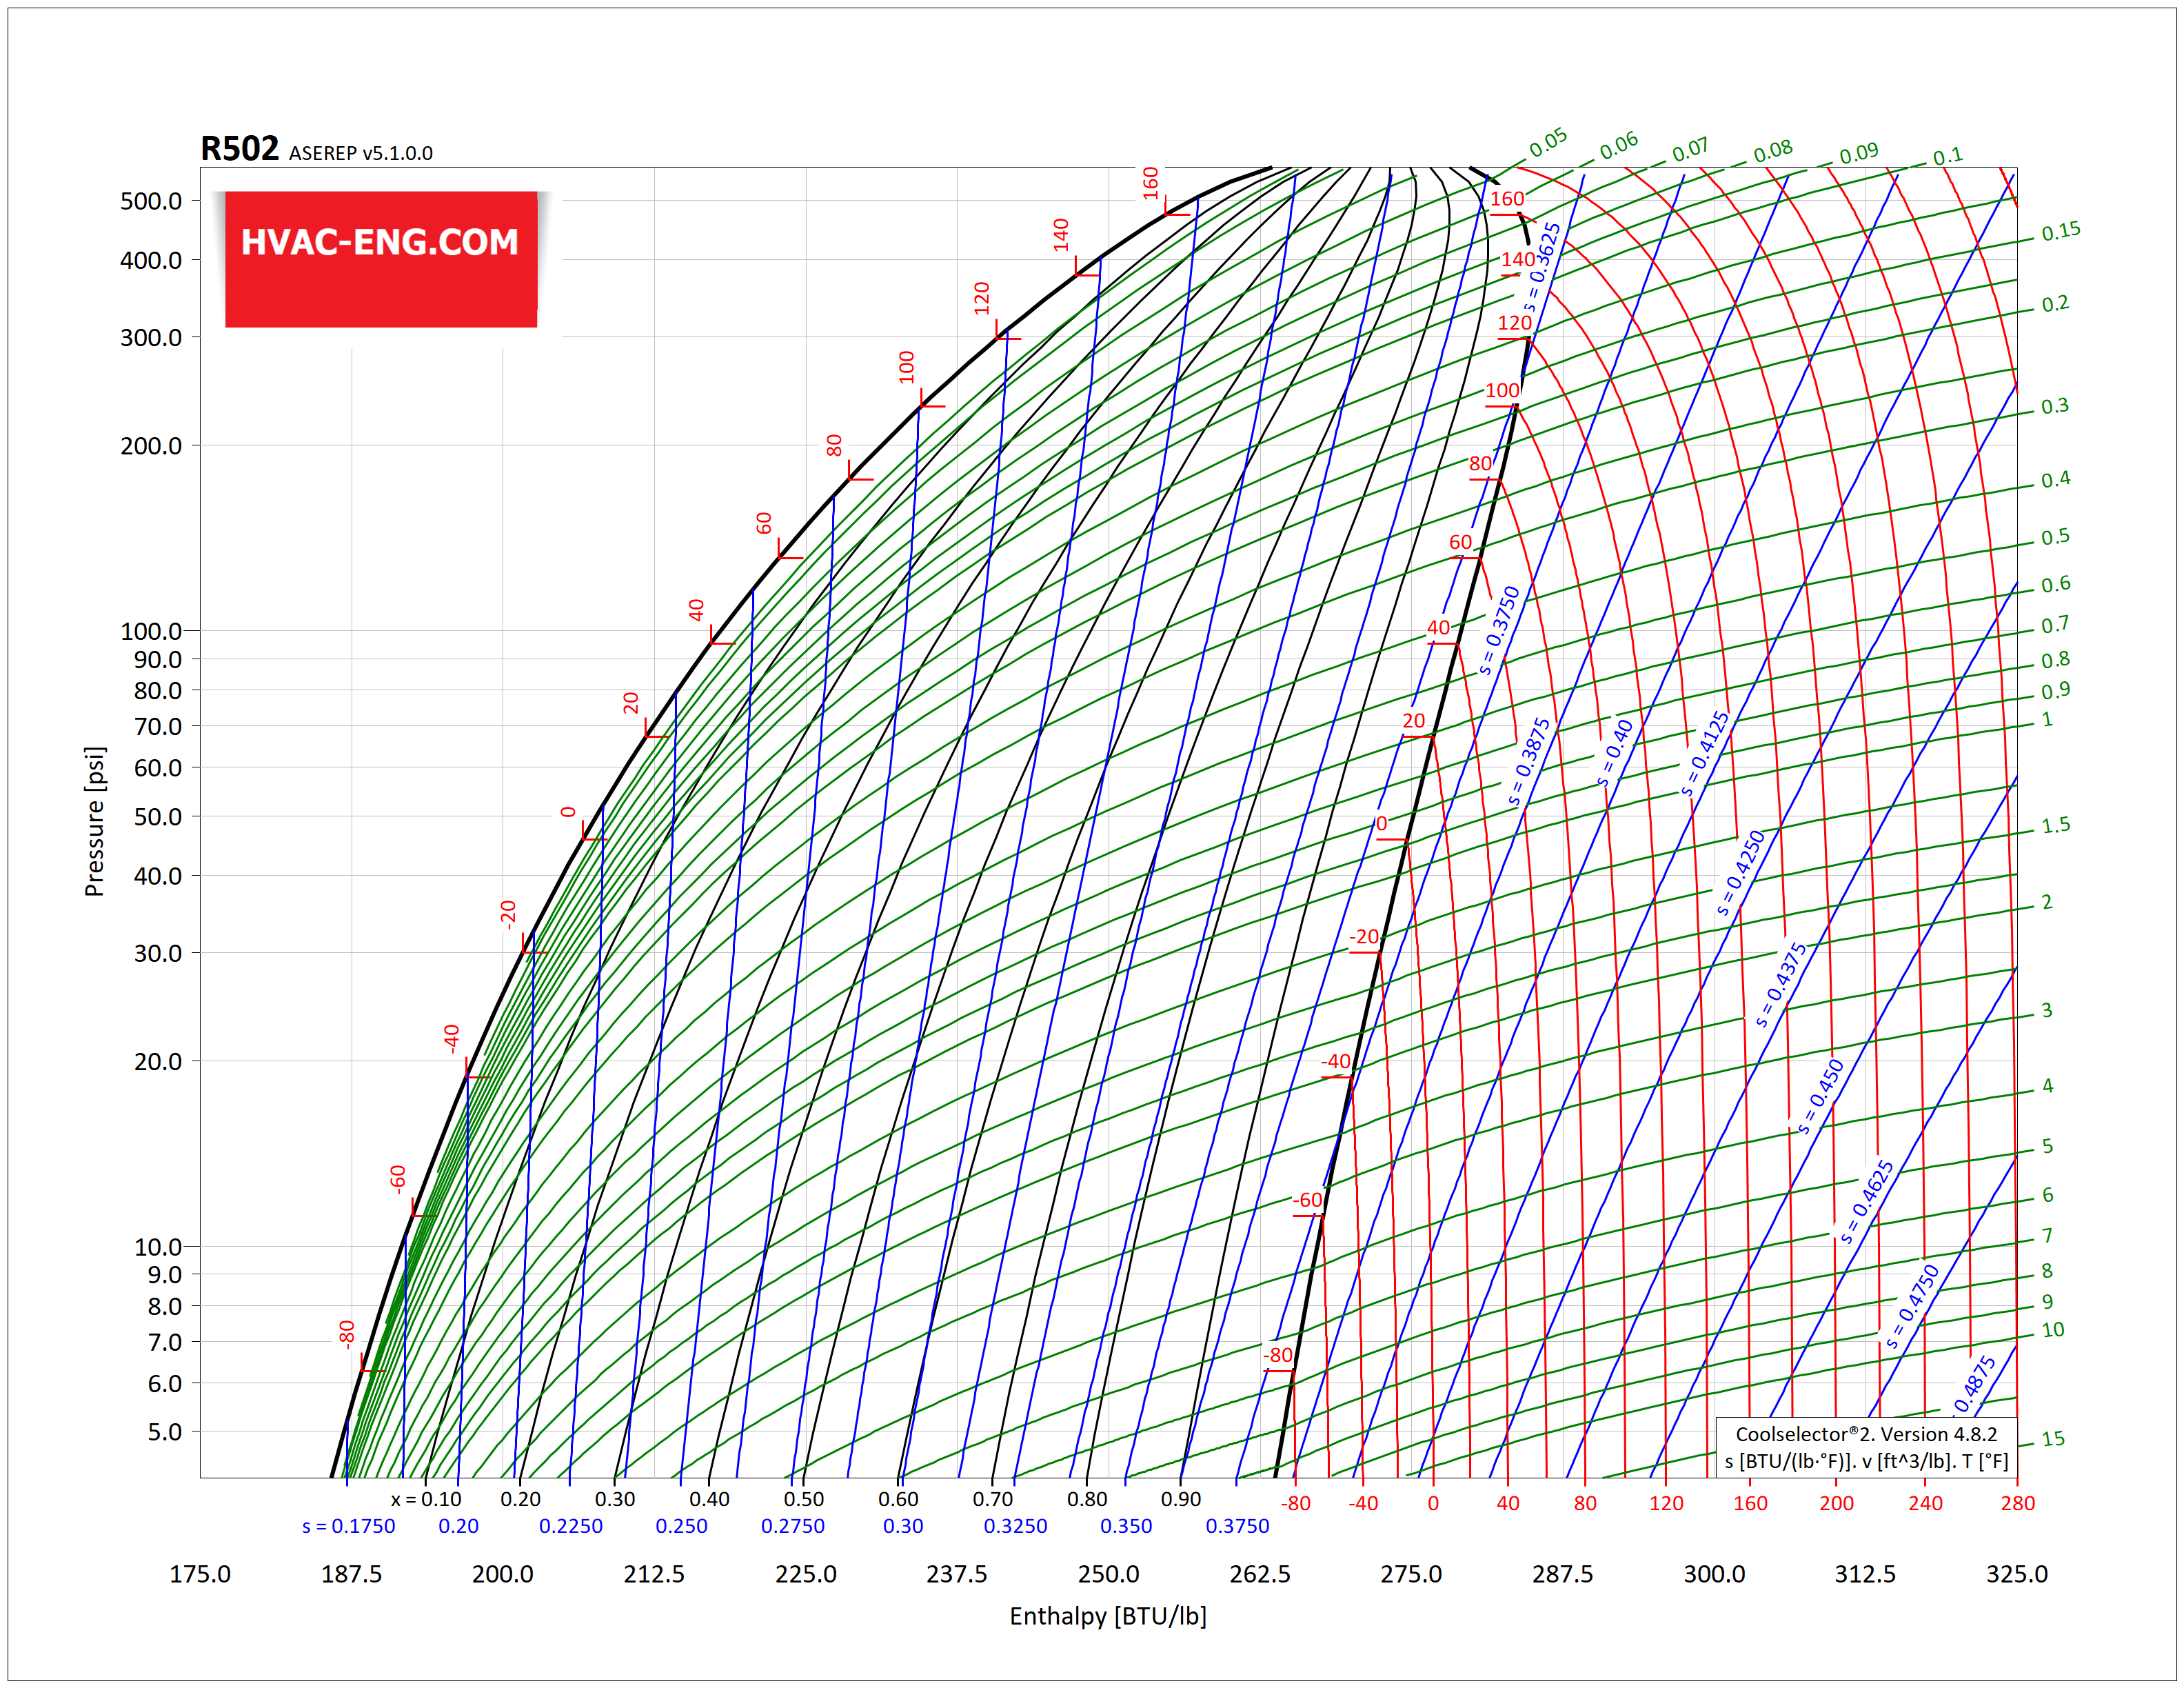
Ph エンタルピー図は次の線で構成されます。

  1. 定圧ライン
  2. 一定エンタルピー線
  3. 飽和線
  4. 等温線
  5. 等エントロピー線
  6. 一定のボリュームライン

エンタルピーh” は X 軸に沿っており、絶対圧力は”p」は y 軸に沿っており、両方とも対数スケールで表されます。 の 飽和液ライン 蒸気と液体の冷媒が共存する二相領域から過冷却された液体を分離します。 の 飽和蒸気ライン この二相領域を過熱蒸気から分離します。 二相領域では、一定乾燥度画分品質線が蒸気と液体の混合物を細分します。 の 一定温度 サブクール液体領域では線はほぼ垂直になります。 より高い温度では、飽和液体線に近い曲線になります。 二相領域では恒温線が水平になります。 また、過熱領域では、 定エントロピー 線は急激に上向きに傾斜し、等量線はより平らになります。 どちらも少し曲がっています。

この記事は、 古い 記事、ユーザーから好評だったので、PH ダイアグラム リストを更新し、世界の商用冷媒のより完全なリストを提供することにしました。 表にリストされている冷媒をクリックすると、高品質の冷媒チャートに簡単にアクセスできます。

FREQUENTLY ASKED QUESTIONS

What is the significance of constant pressure lines on a P-H diagram?
Constant pressure lines on a P-H diagram represent the variation of enthalpy with temperature at a specific pressure. These lines are crucial in refrigeration cycle analysis as they enable the calculation of heat transfer and work done during various processes, such as compression, expansion, and evaporation. By analyzing the slope and curvature of these lines, engineers can determine the thermodynamic properties of refrigerants and optimize system design and operation.
How do isothermal lines differ from isentropic lines on a P-H diagram?

Isothermal lines on a P-H diagram represent constant temperature, whereas isentropic lines represent constant entropy. Isothermal lines are horizontal and indicate no change in temperature, whereas isentropic lines are curved and indicate a reversible adiabatic process. Understanding the difference between these lines is essential for analyzing refrigeration cycles, as isentropic processes are idealized and isothermal processes are more realistic.

What is the role of saturation lines on a P-H diagram?

Saturation lines on a P-H diagram separate the liquid and vapor regions of a refrigerant. These lines indicate the boundary between the saturated liquid and saturated vapor states. By analyzing the saturation lines, engineers can determine the thermodynamic properties of refrigerants at specific temperatures and pressures, which is critical for designing and optimizing refrigeration systems.

How can a P-H diagram be used to analyze a vapor-compression refrigeration cycle?

A P-H diagram can be used to analyze a vapor-compression refrigeration cycle by plotting the various processes, such as compression, condensation, expansion, and evaporation, on the diagram. By analyzing the enthalpy changes and pressure variations during each process, engineers can calculate the coefficient of performance (COP), refrigeration capacity, and energy efficiency of the system. This enables the optimization of system design and operation for improved performance and energy savings.

What are some common applications of P-H diagrams in HVAC and refrigeration systems?

P-H diagrams have numerous applications in HVAC and refrigeration systems, including system design, performance analysis, and optimization. They are used to select refrigerants, determine system capacity, and optimize operating conditions. P-H diagrams are also essential for troubleshooting and diagnosing system malfunctions, such as refrigerant leaks or compressor failures. Additionally, they are used in research and development to improve system efficiency and reduce environmental impact.

How can P-H diagrams be used to compare the performance of different refrigerants?

P-H diagrams can be used to compare the performance of different refrigerants by analyzing their thermodynamic properties, such as enthalpy, entropy, and pressure. By plotting the P-H diagrams for different refrigerants, engineers can compare their performance characteristics, such as refrigeration capacity, energy efficiency, and operating pressures. This enables the selection of the most suitable refrigerant for a specific application, taking into account factors such as environmental impact, safety, and cost.