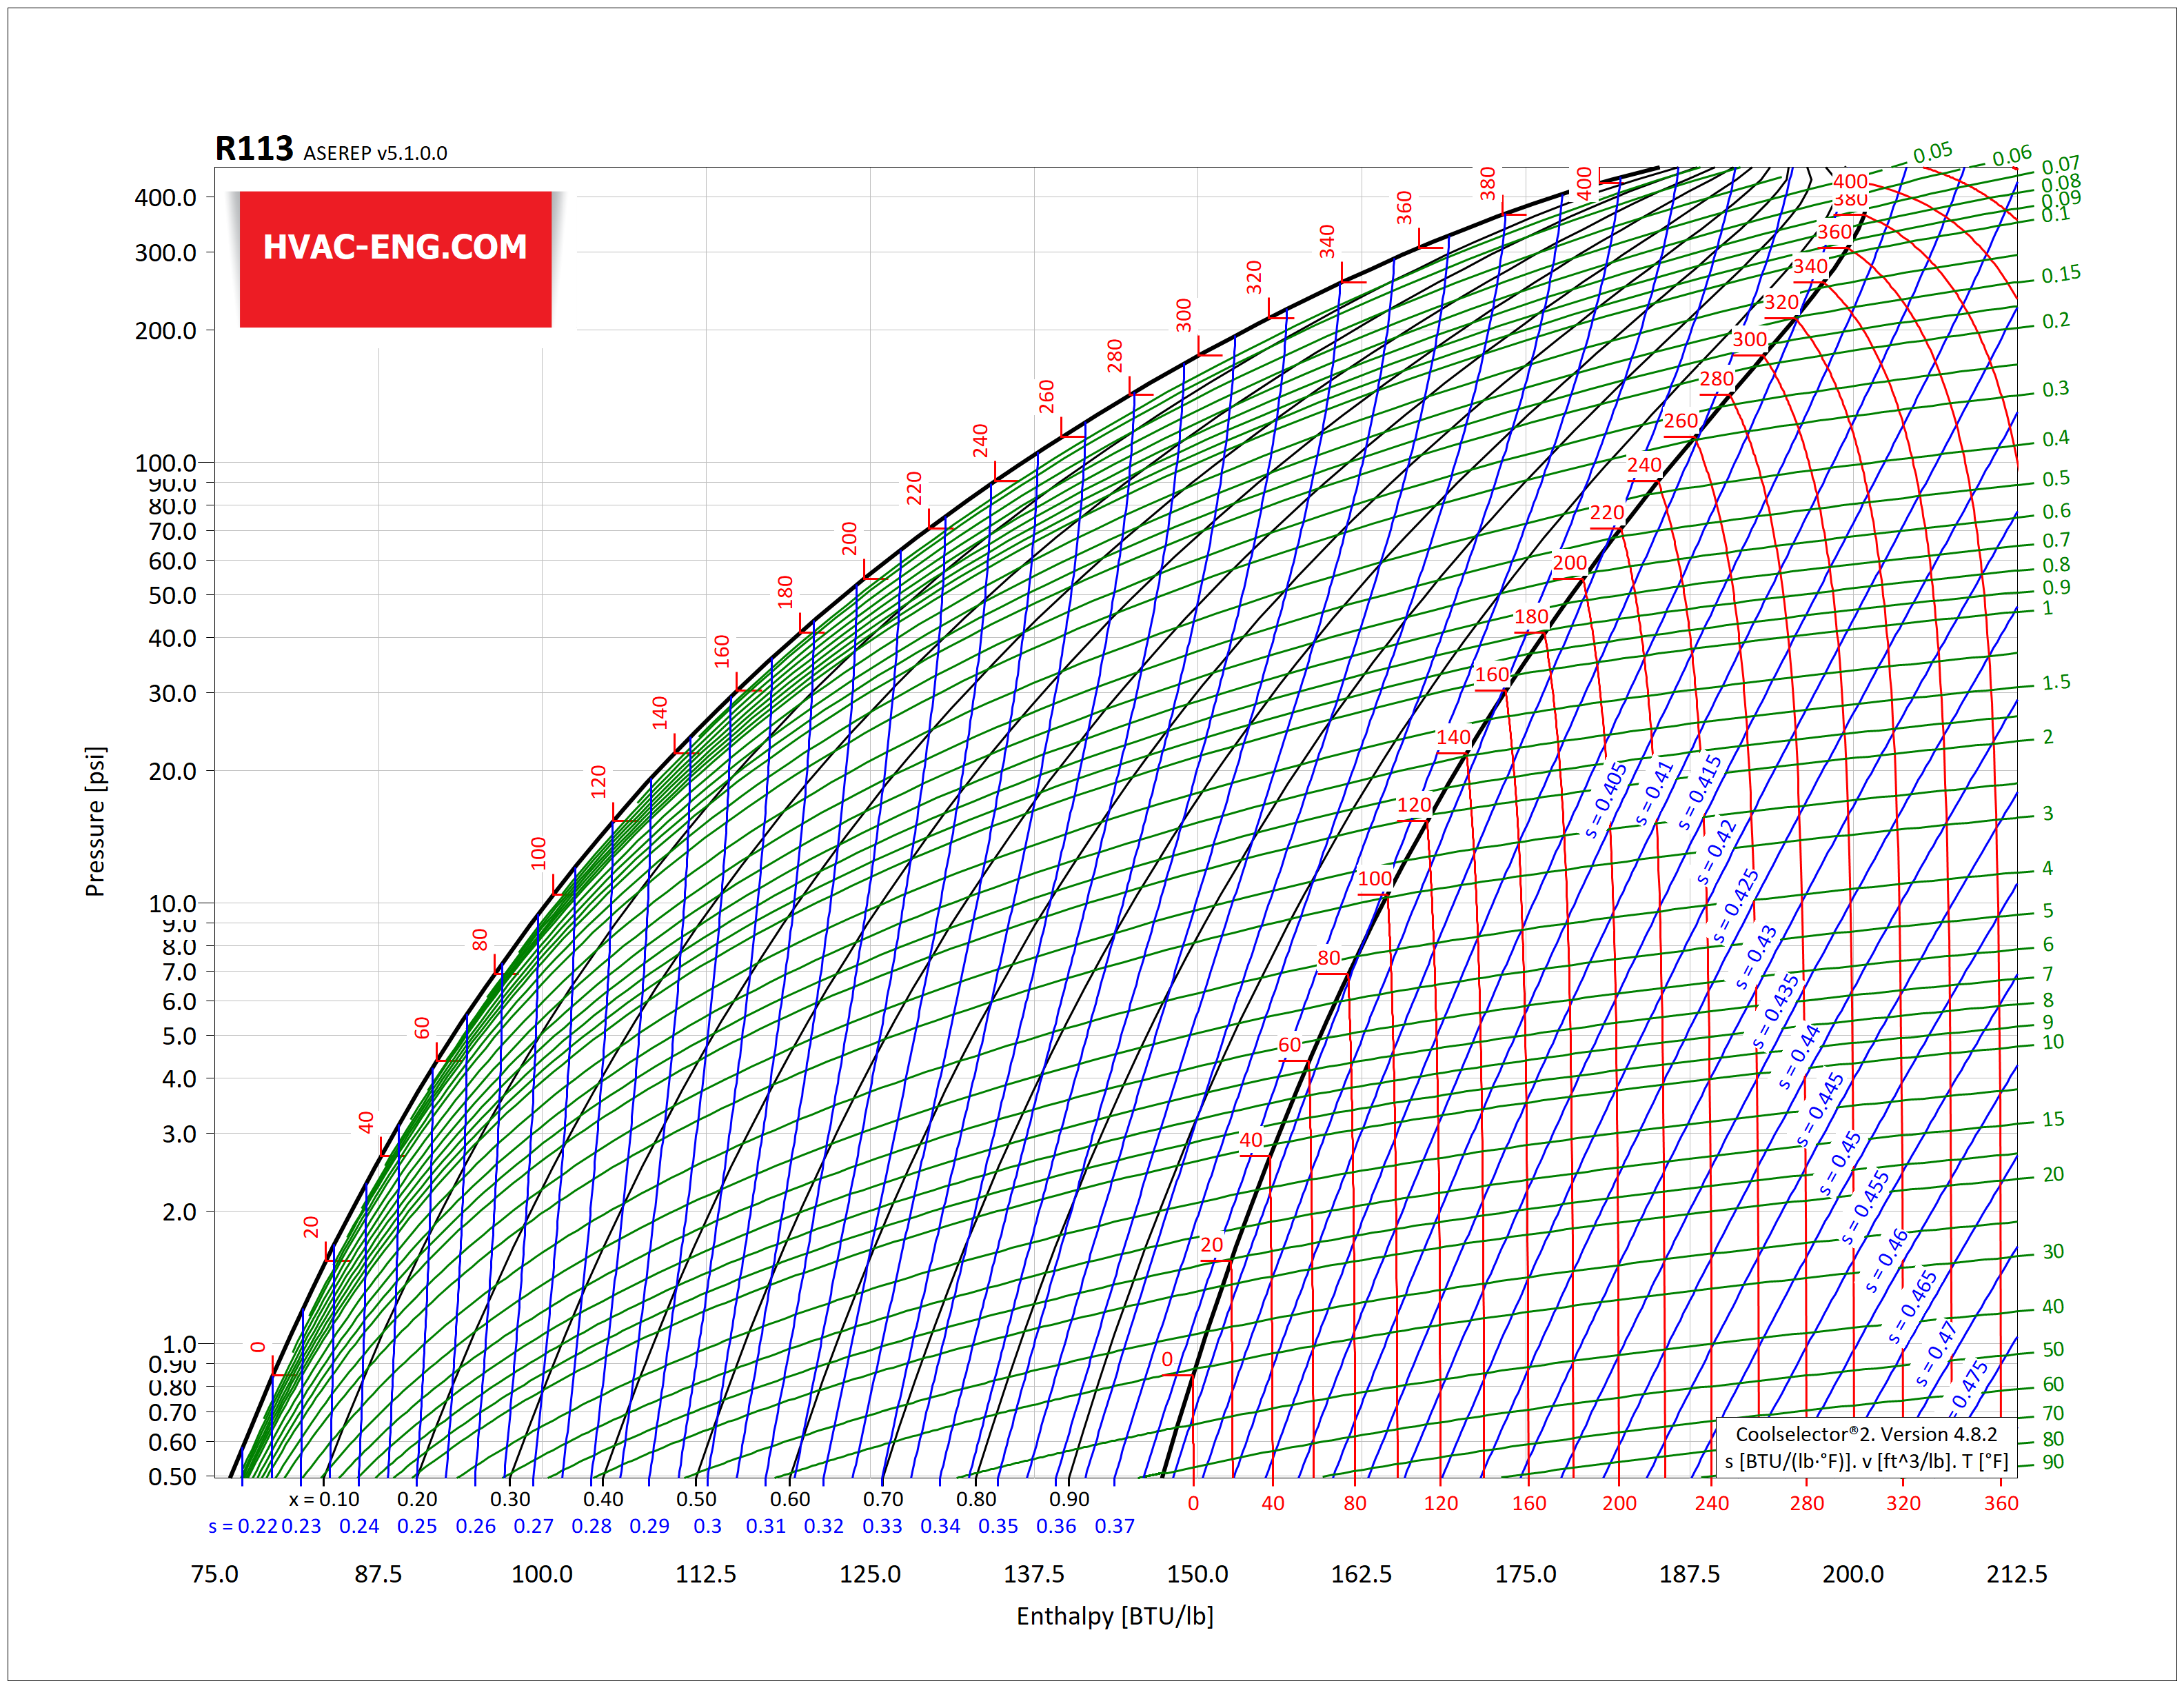
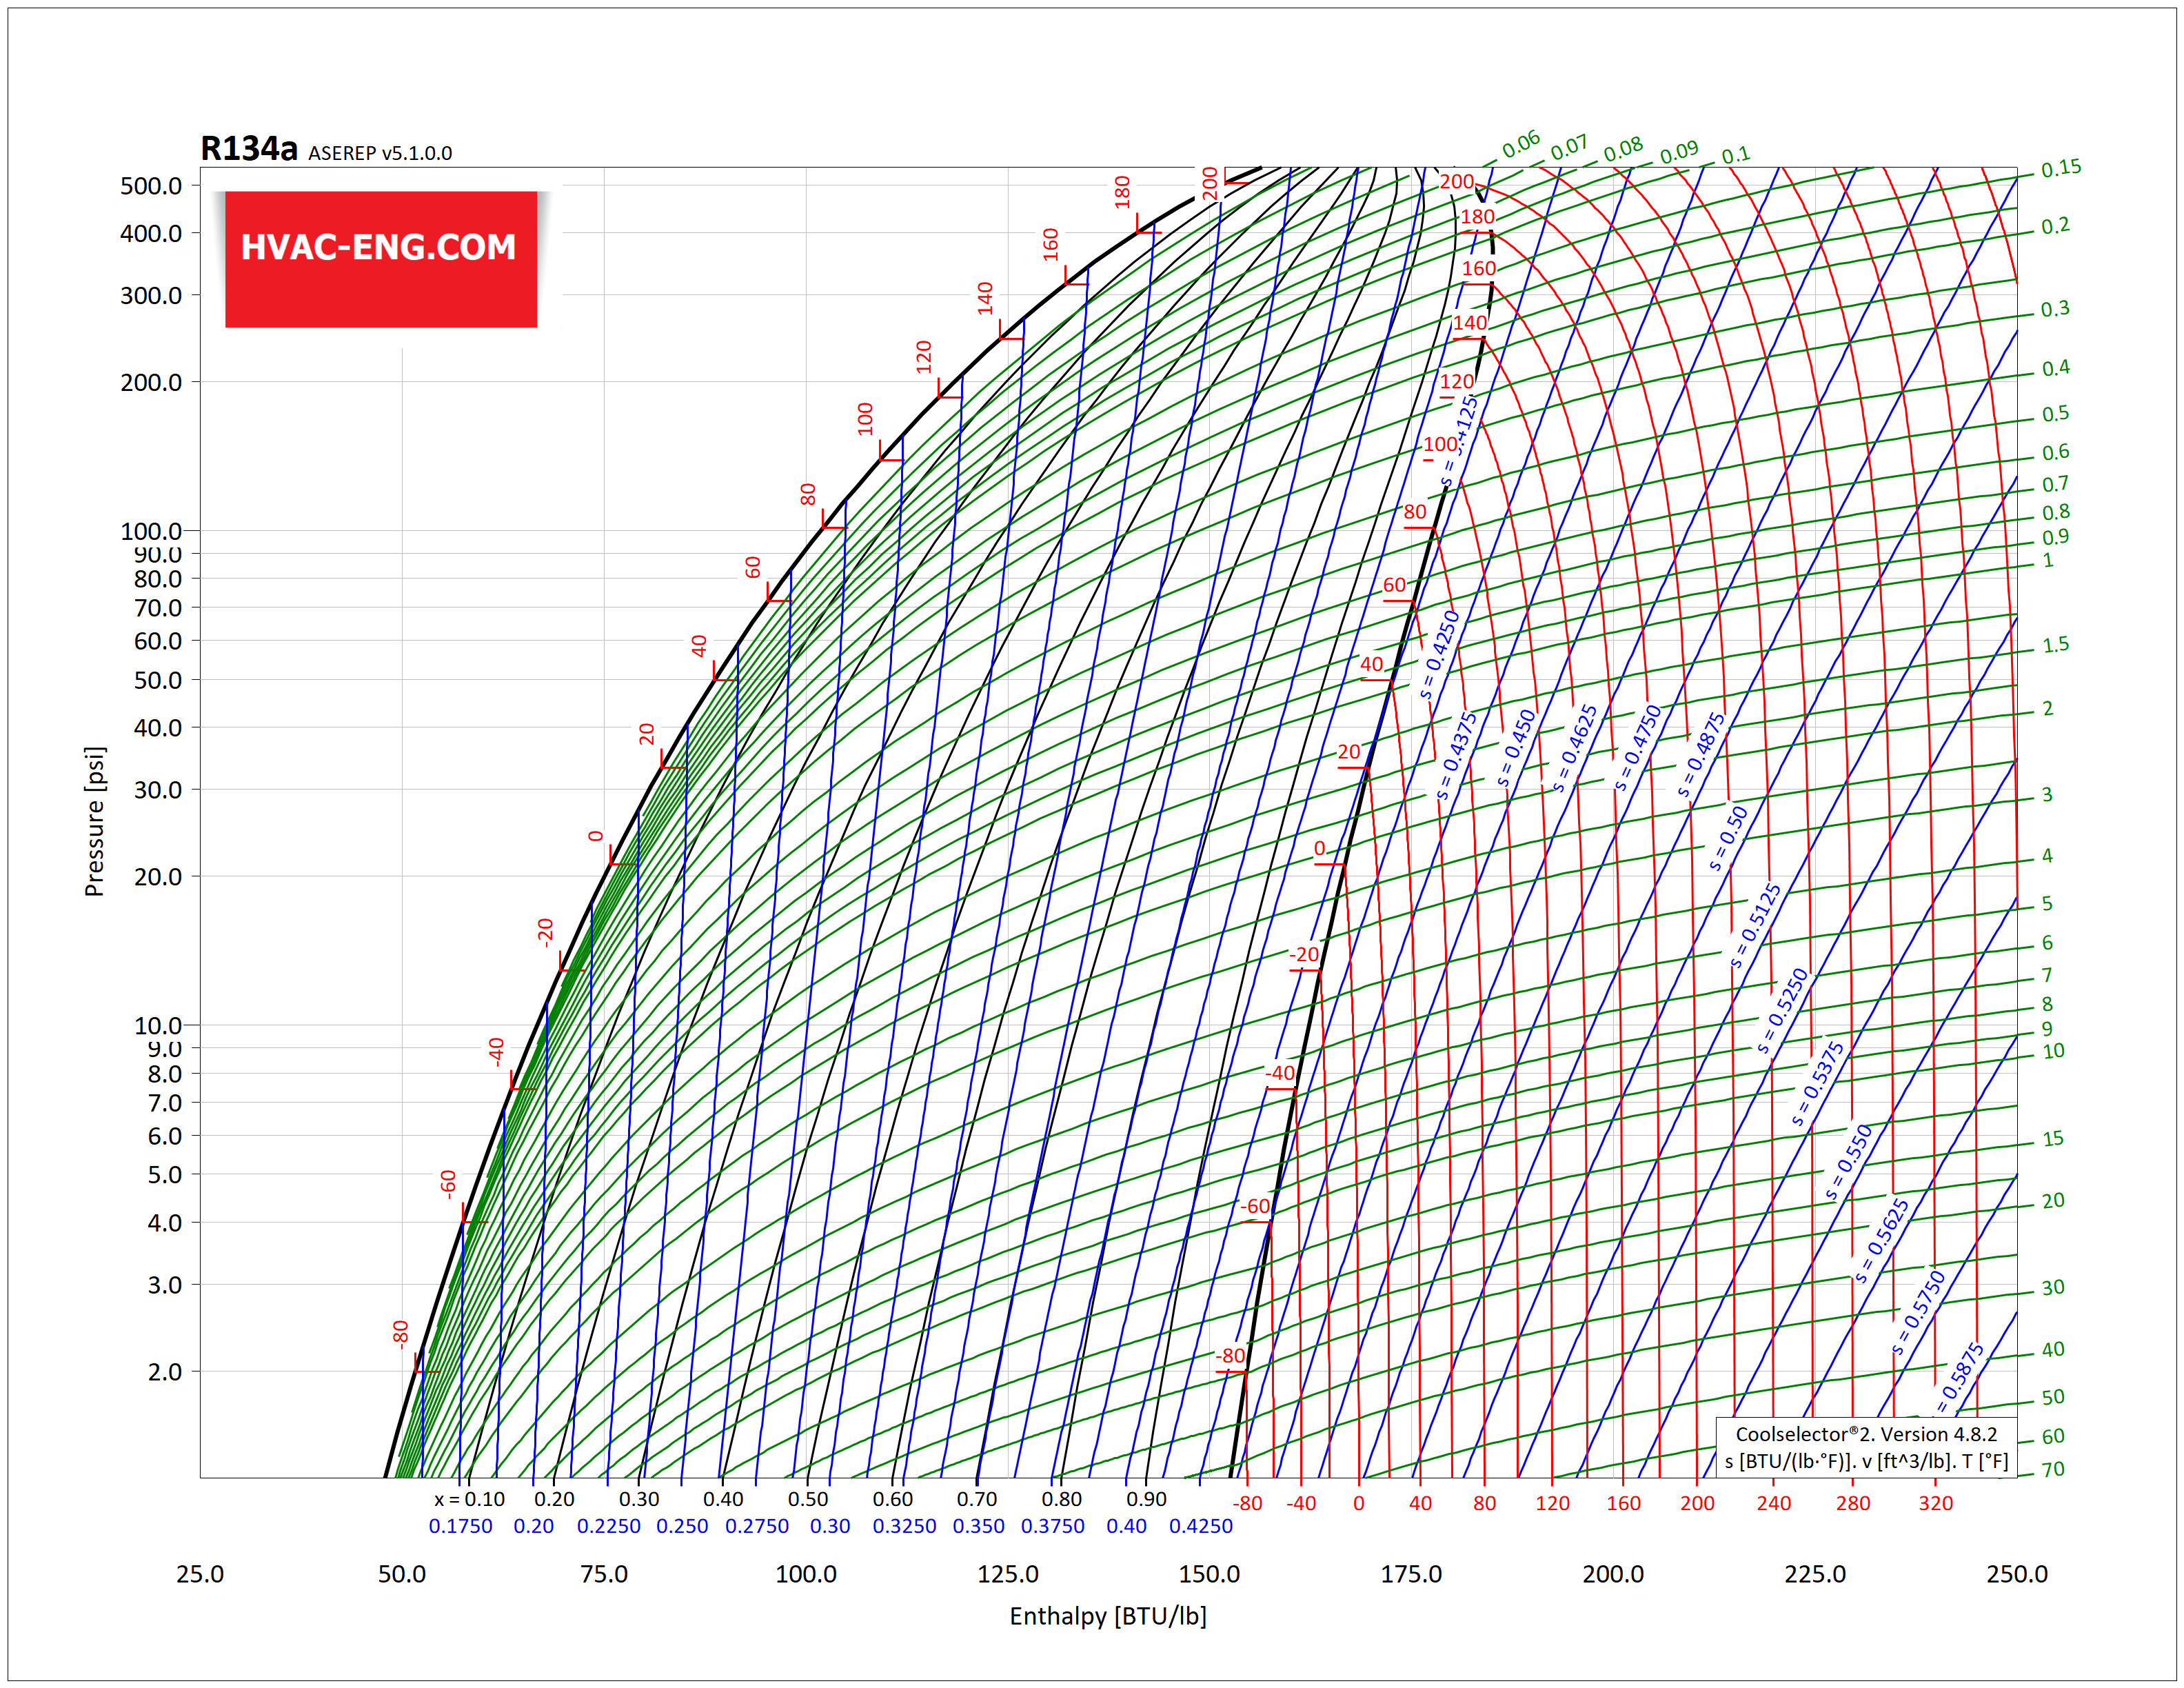
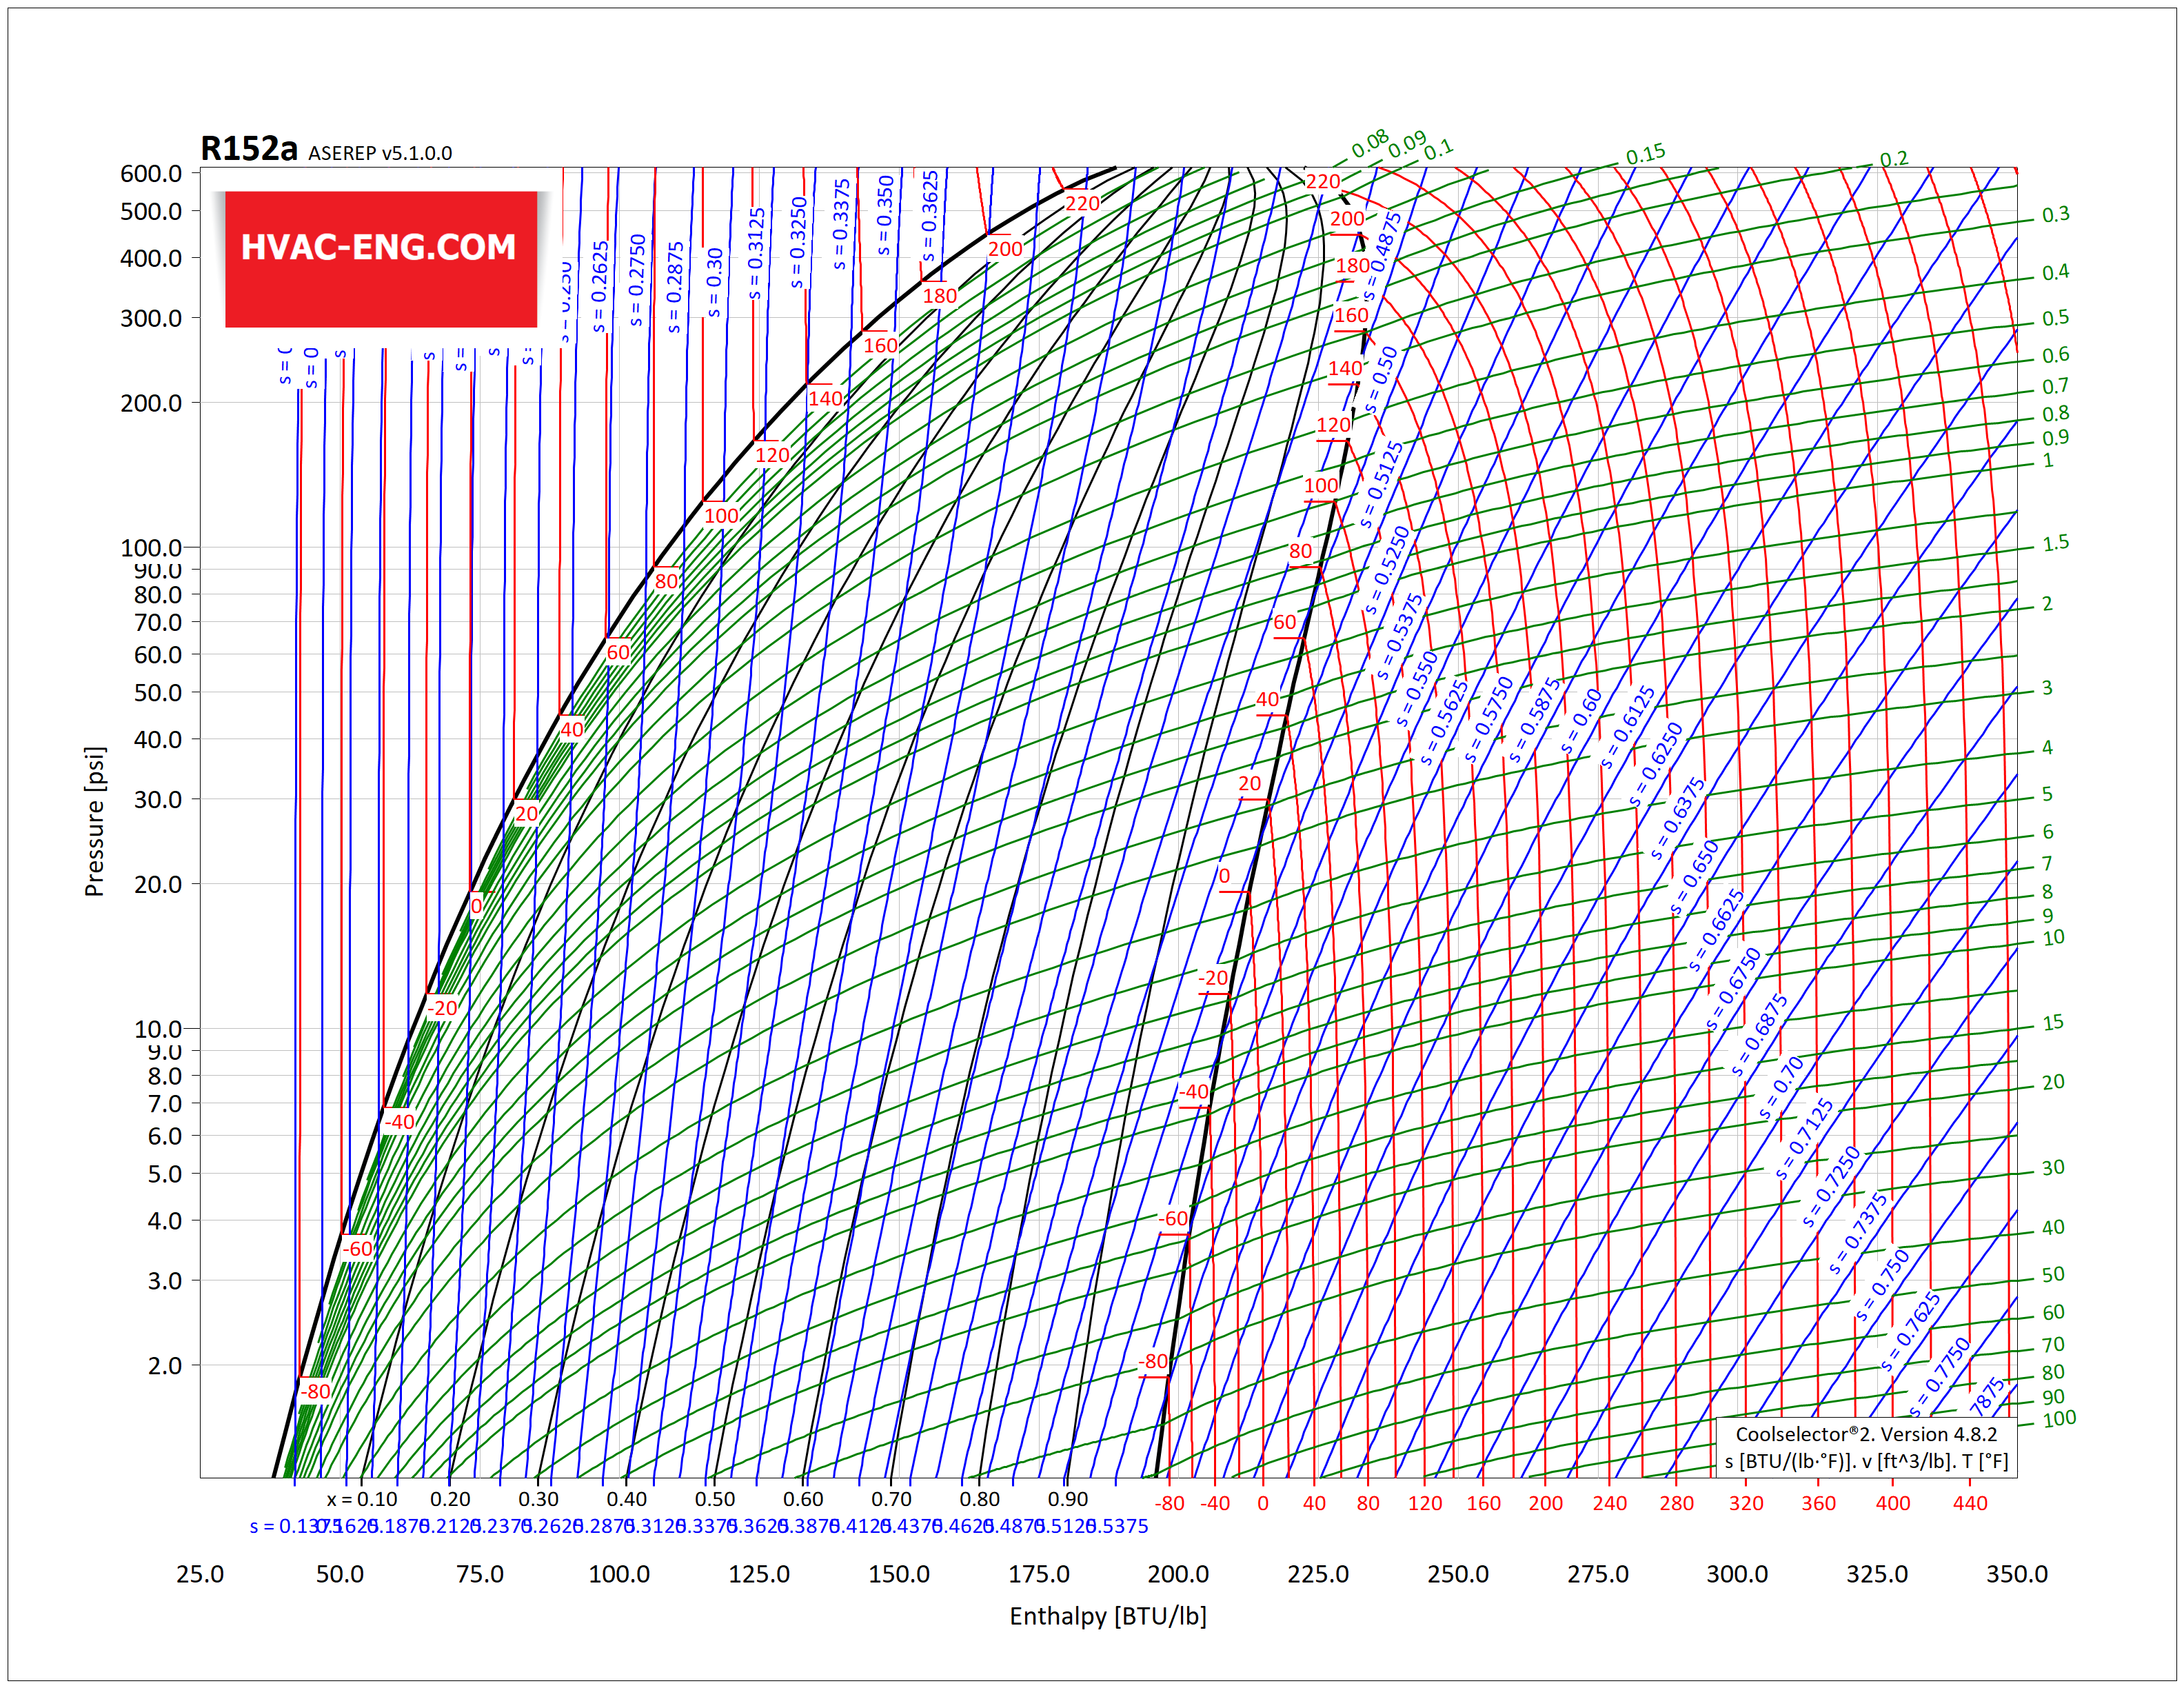
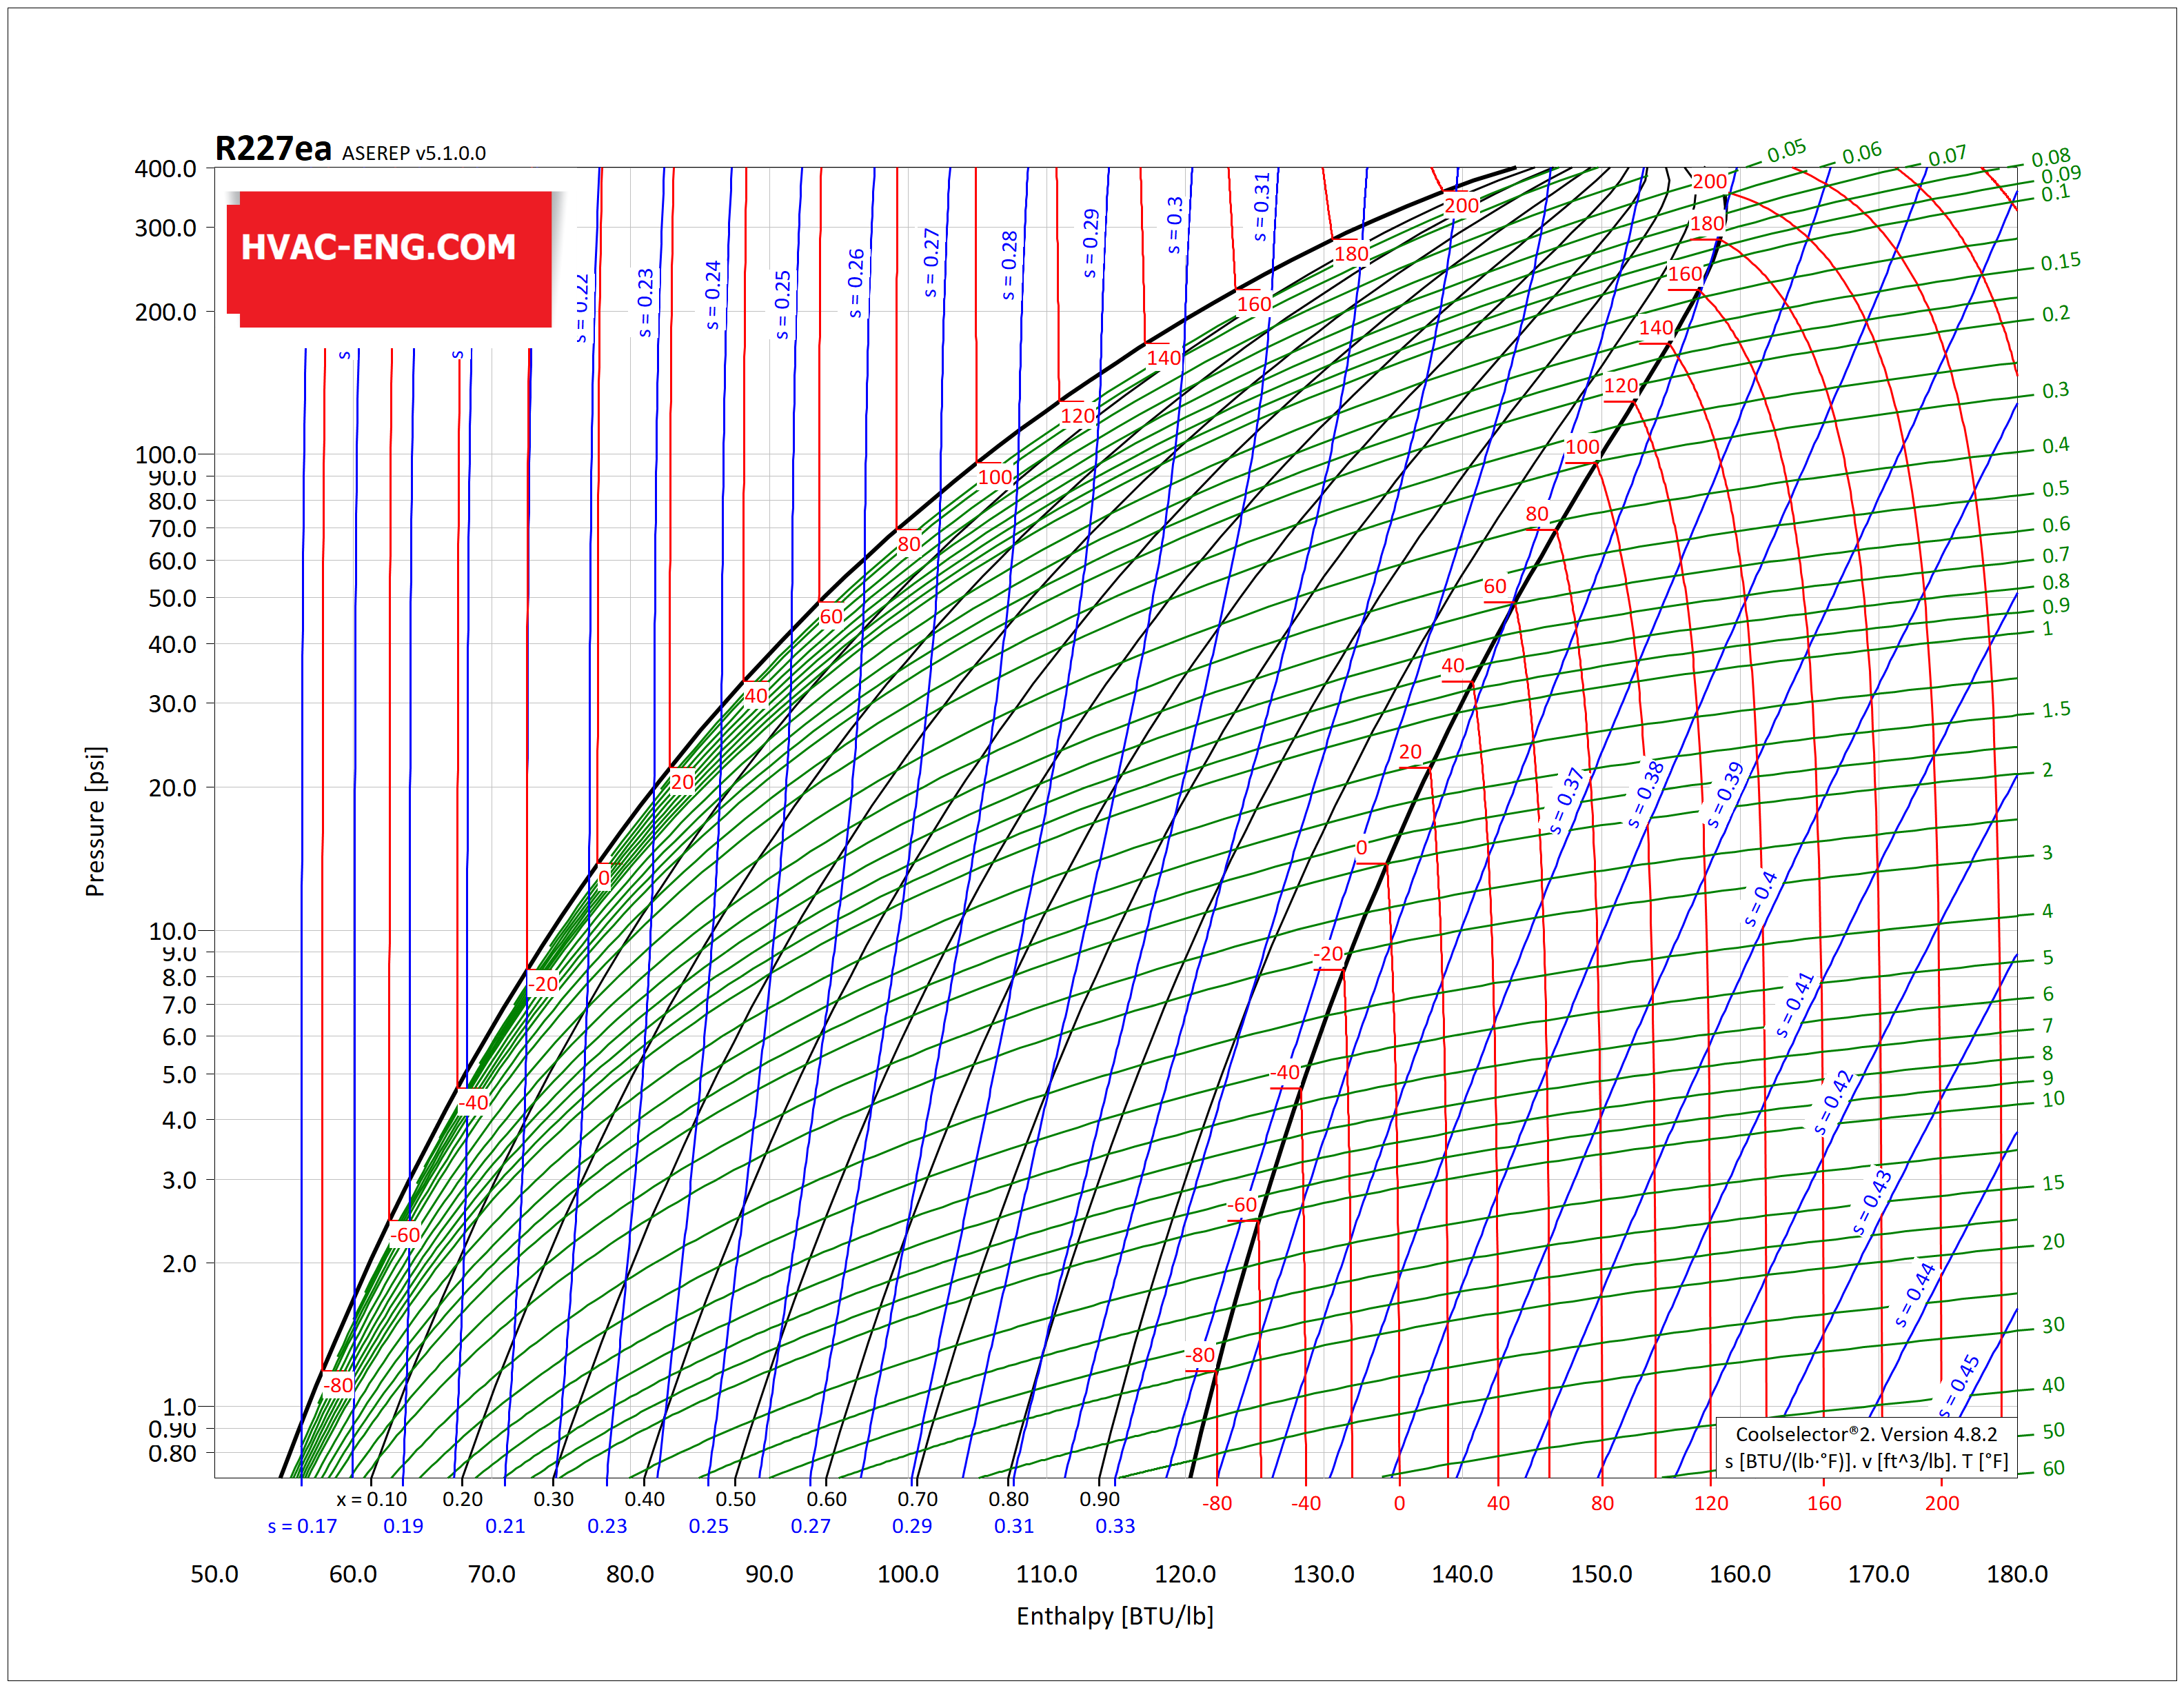
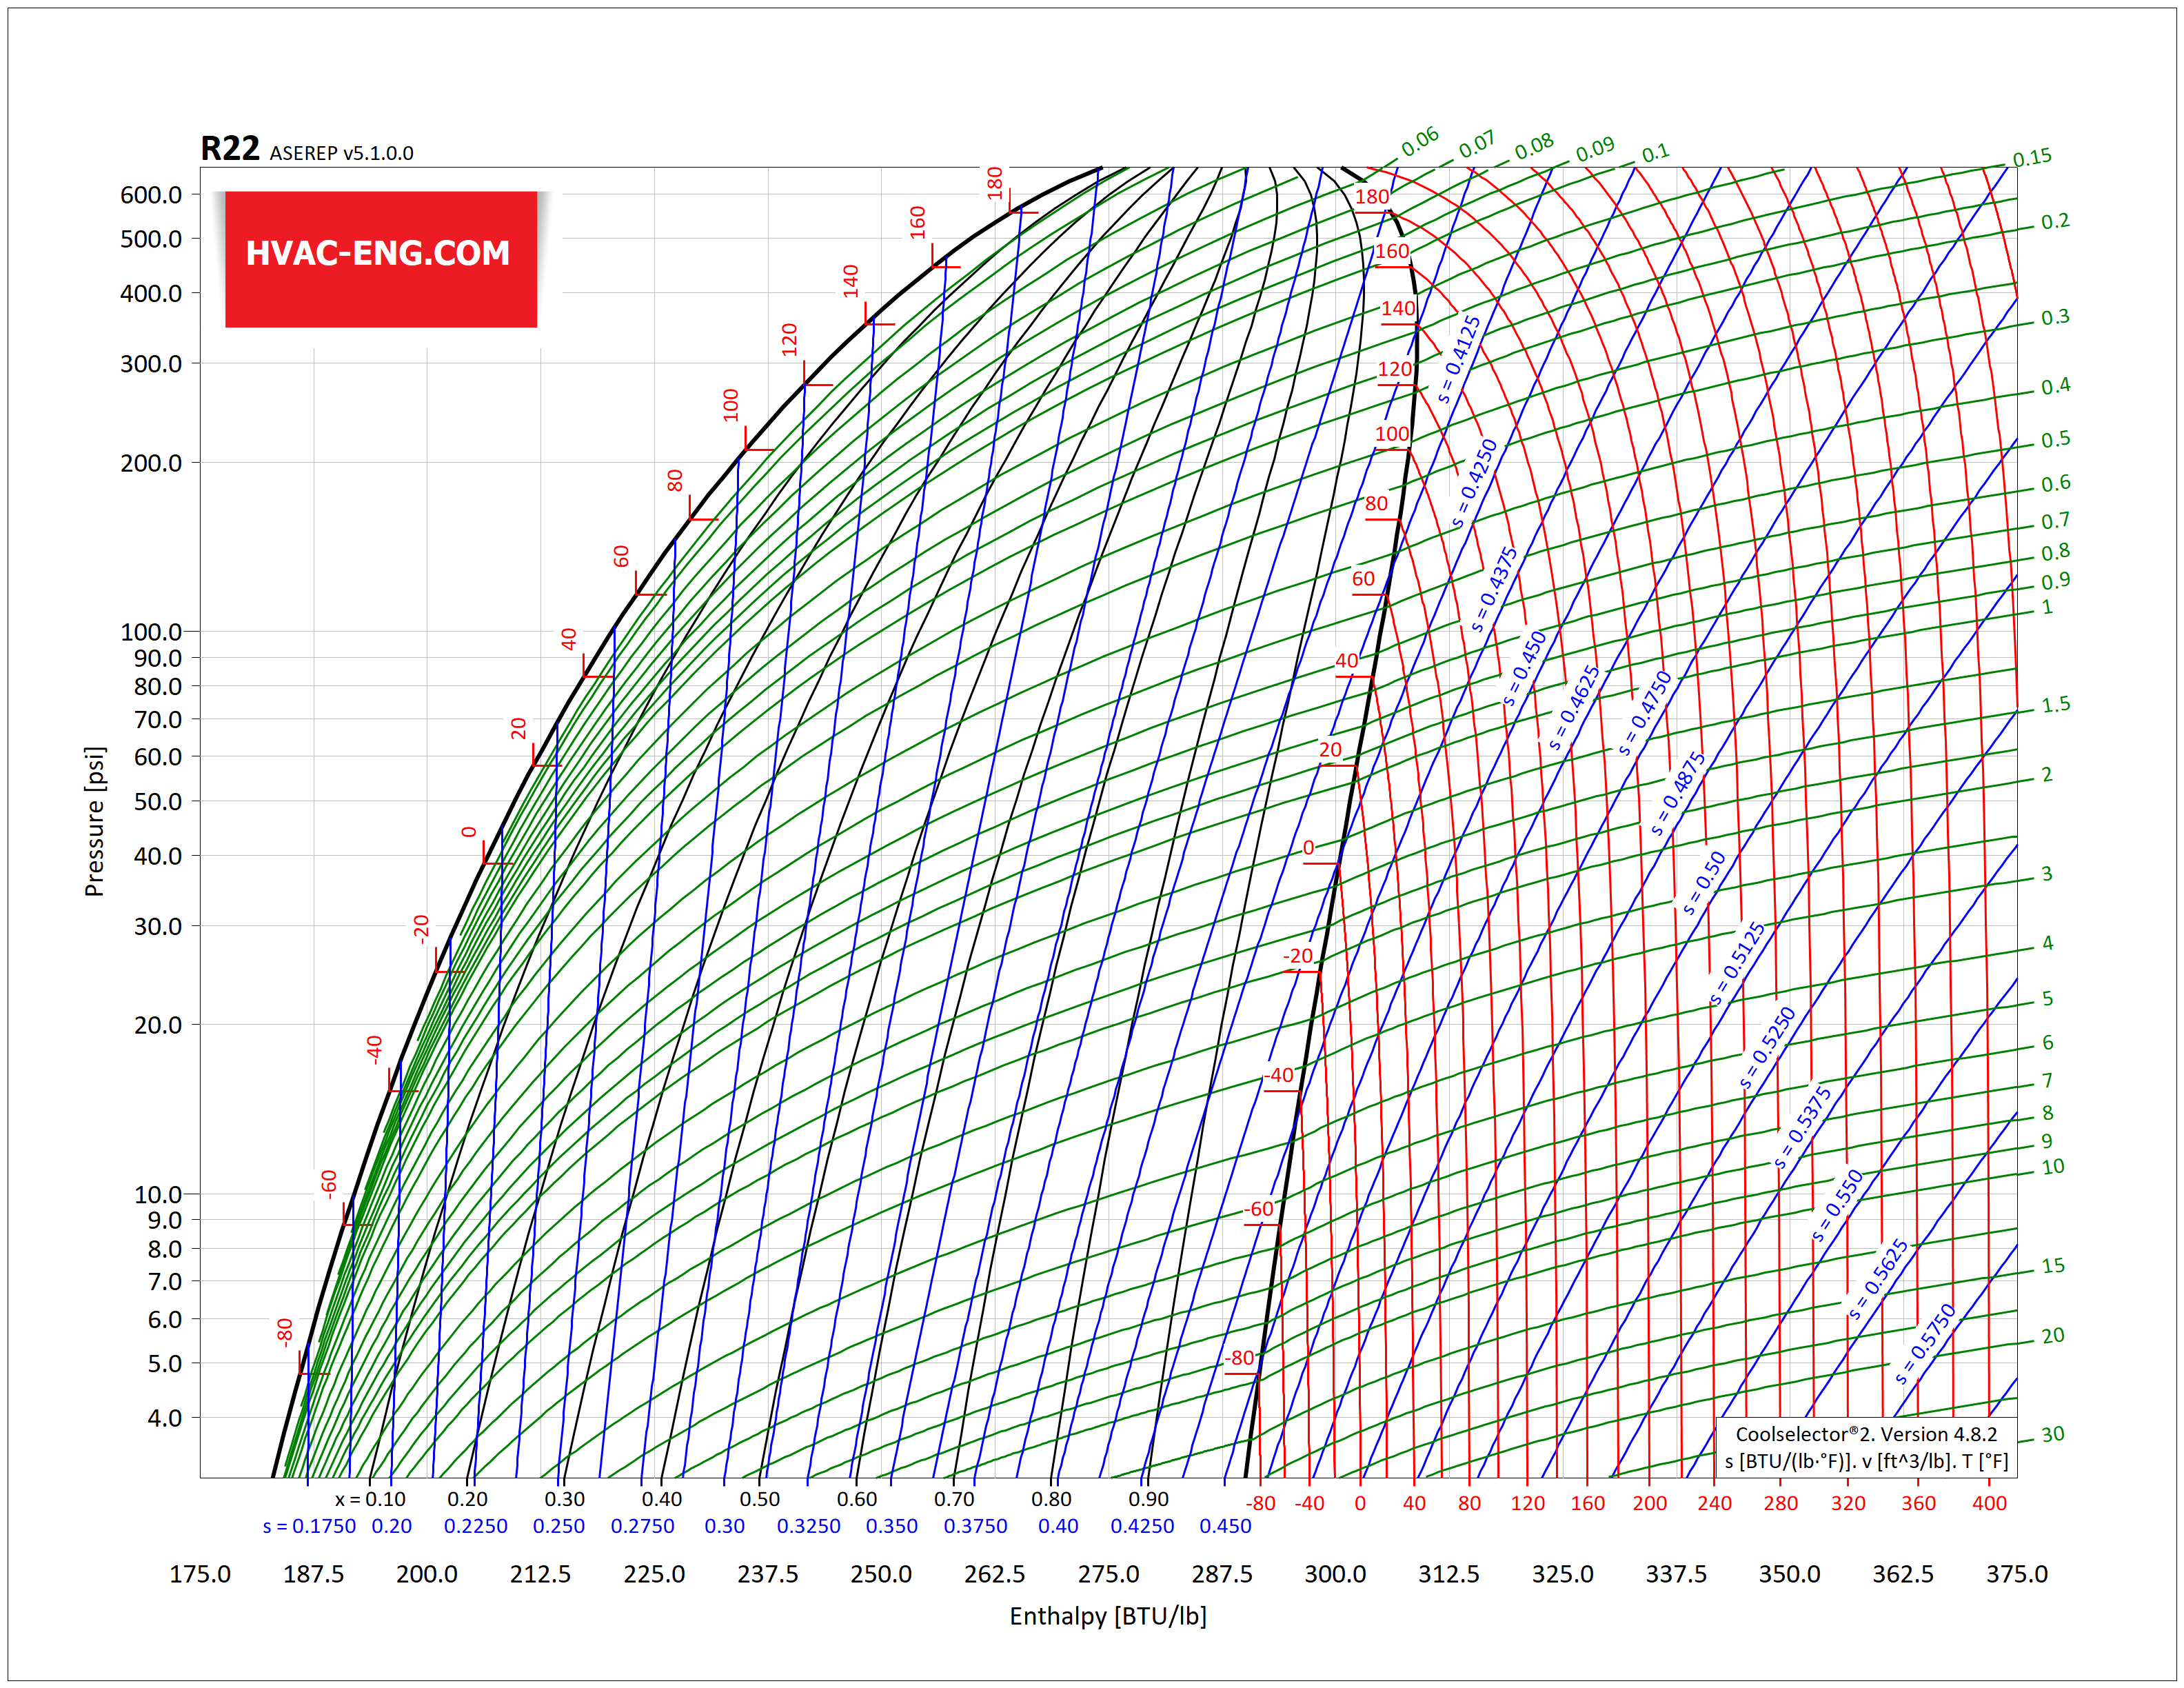
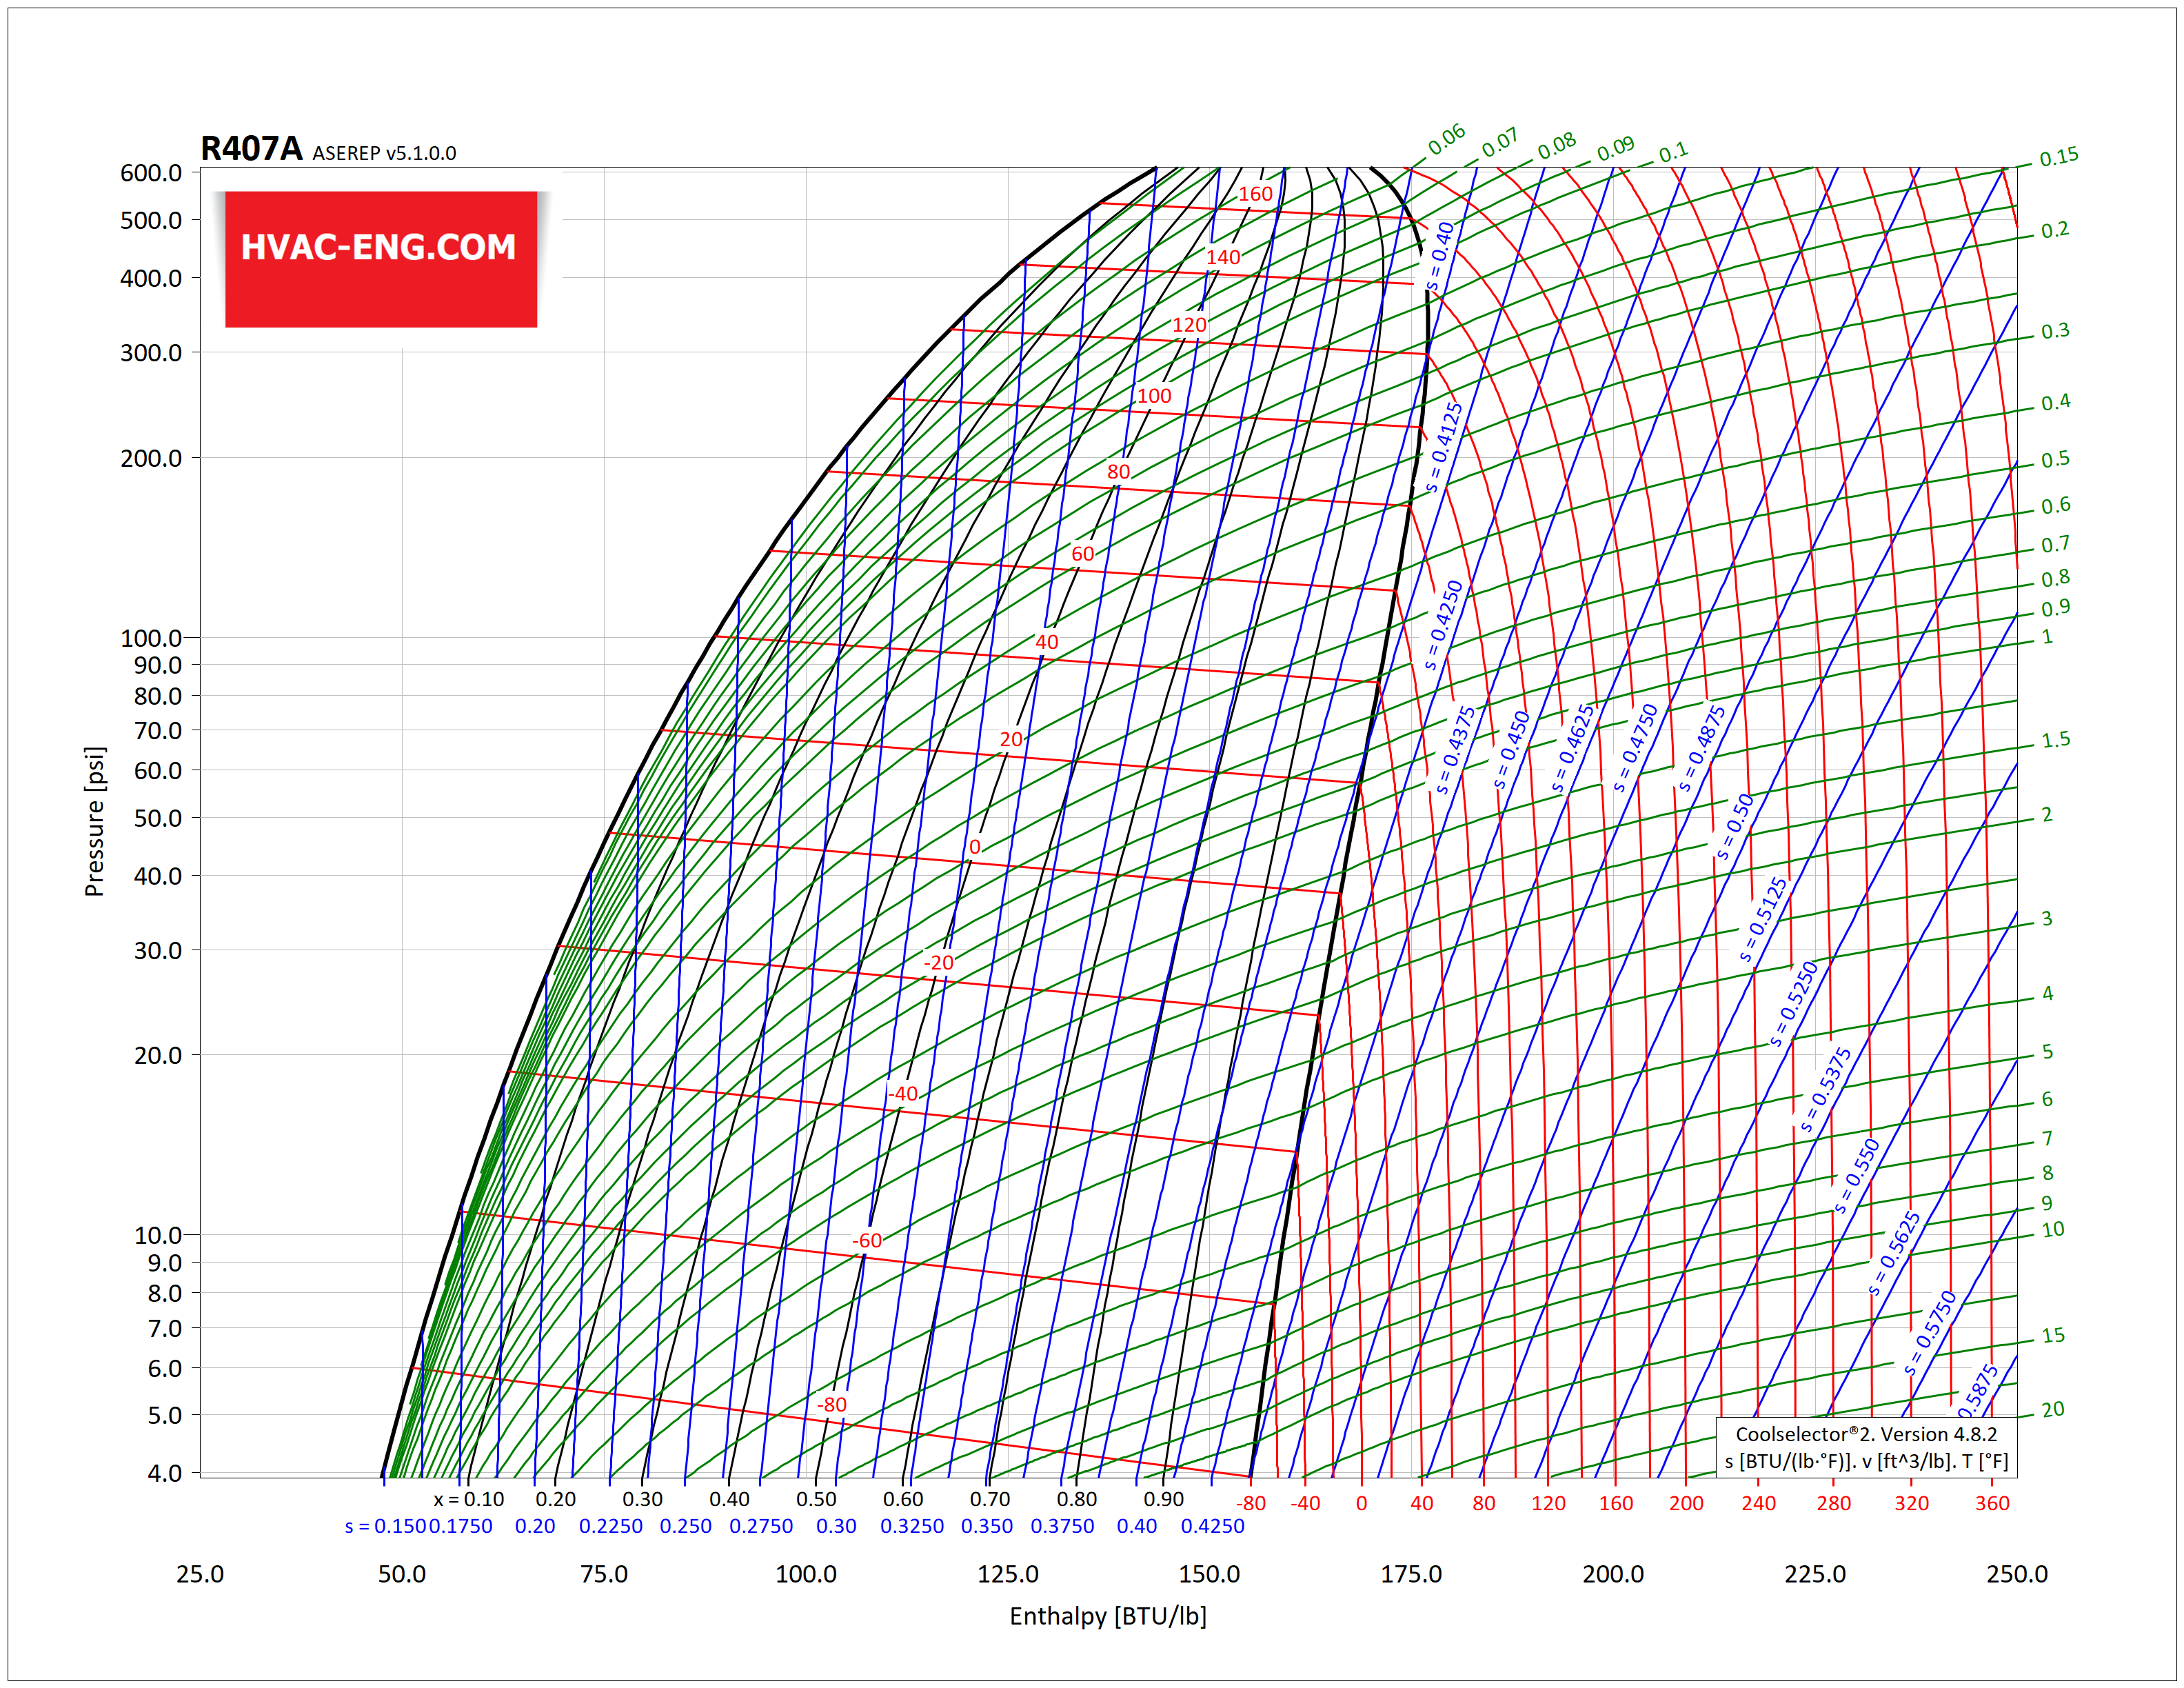
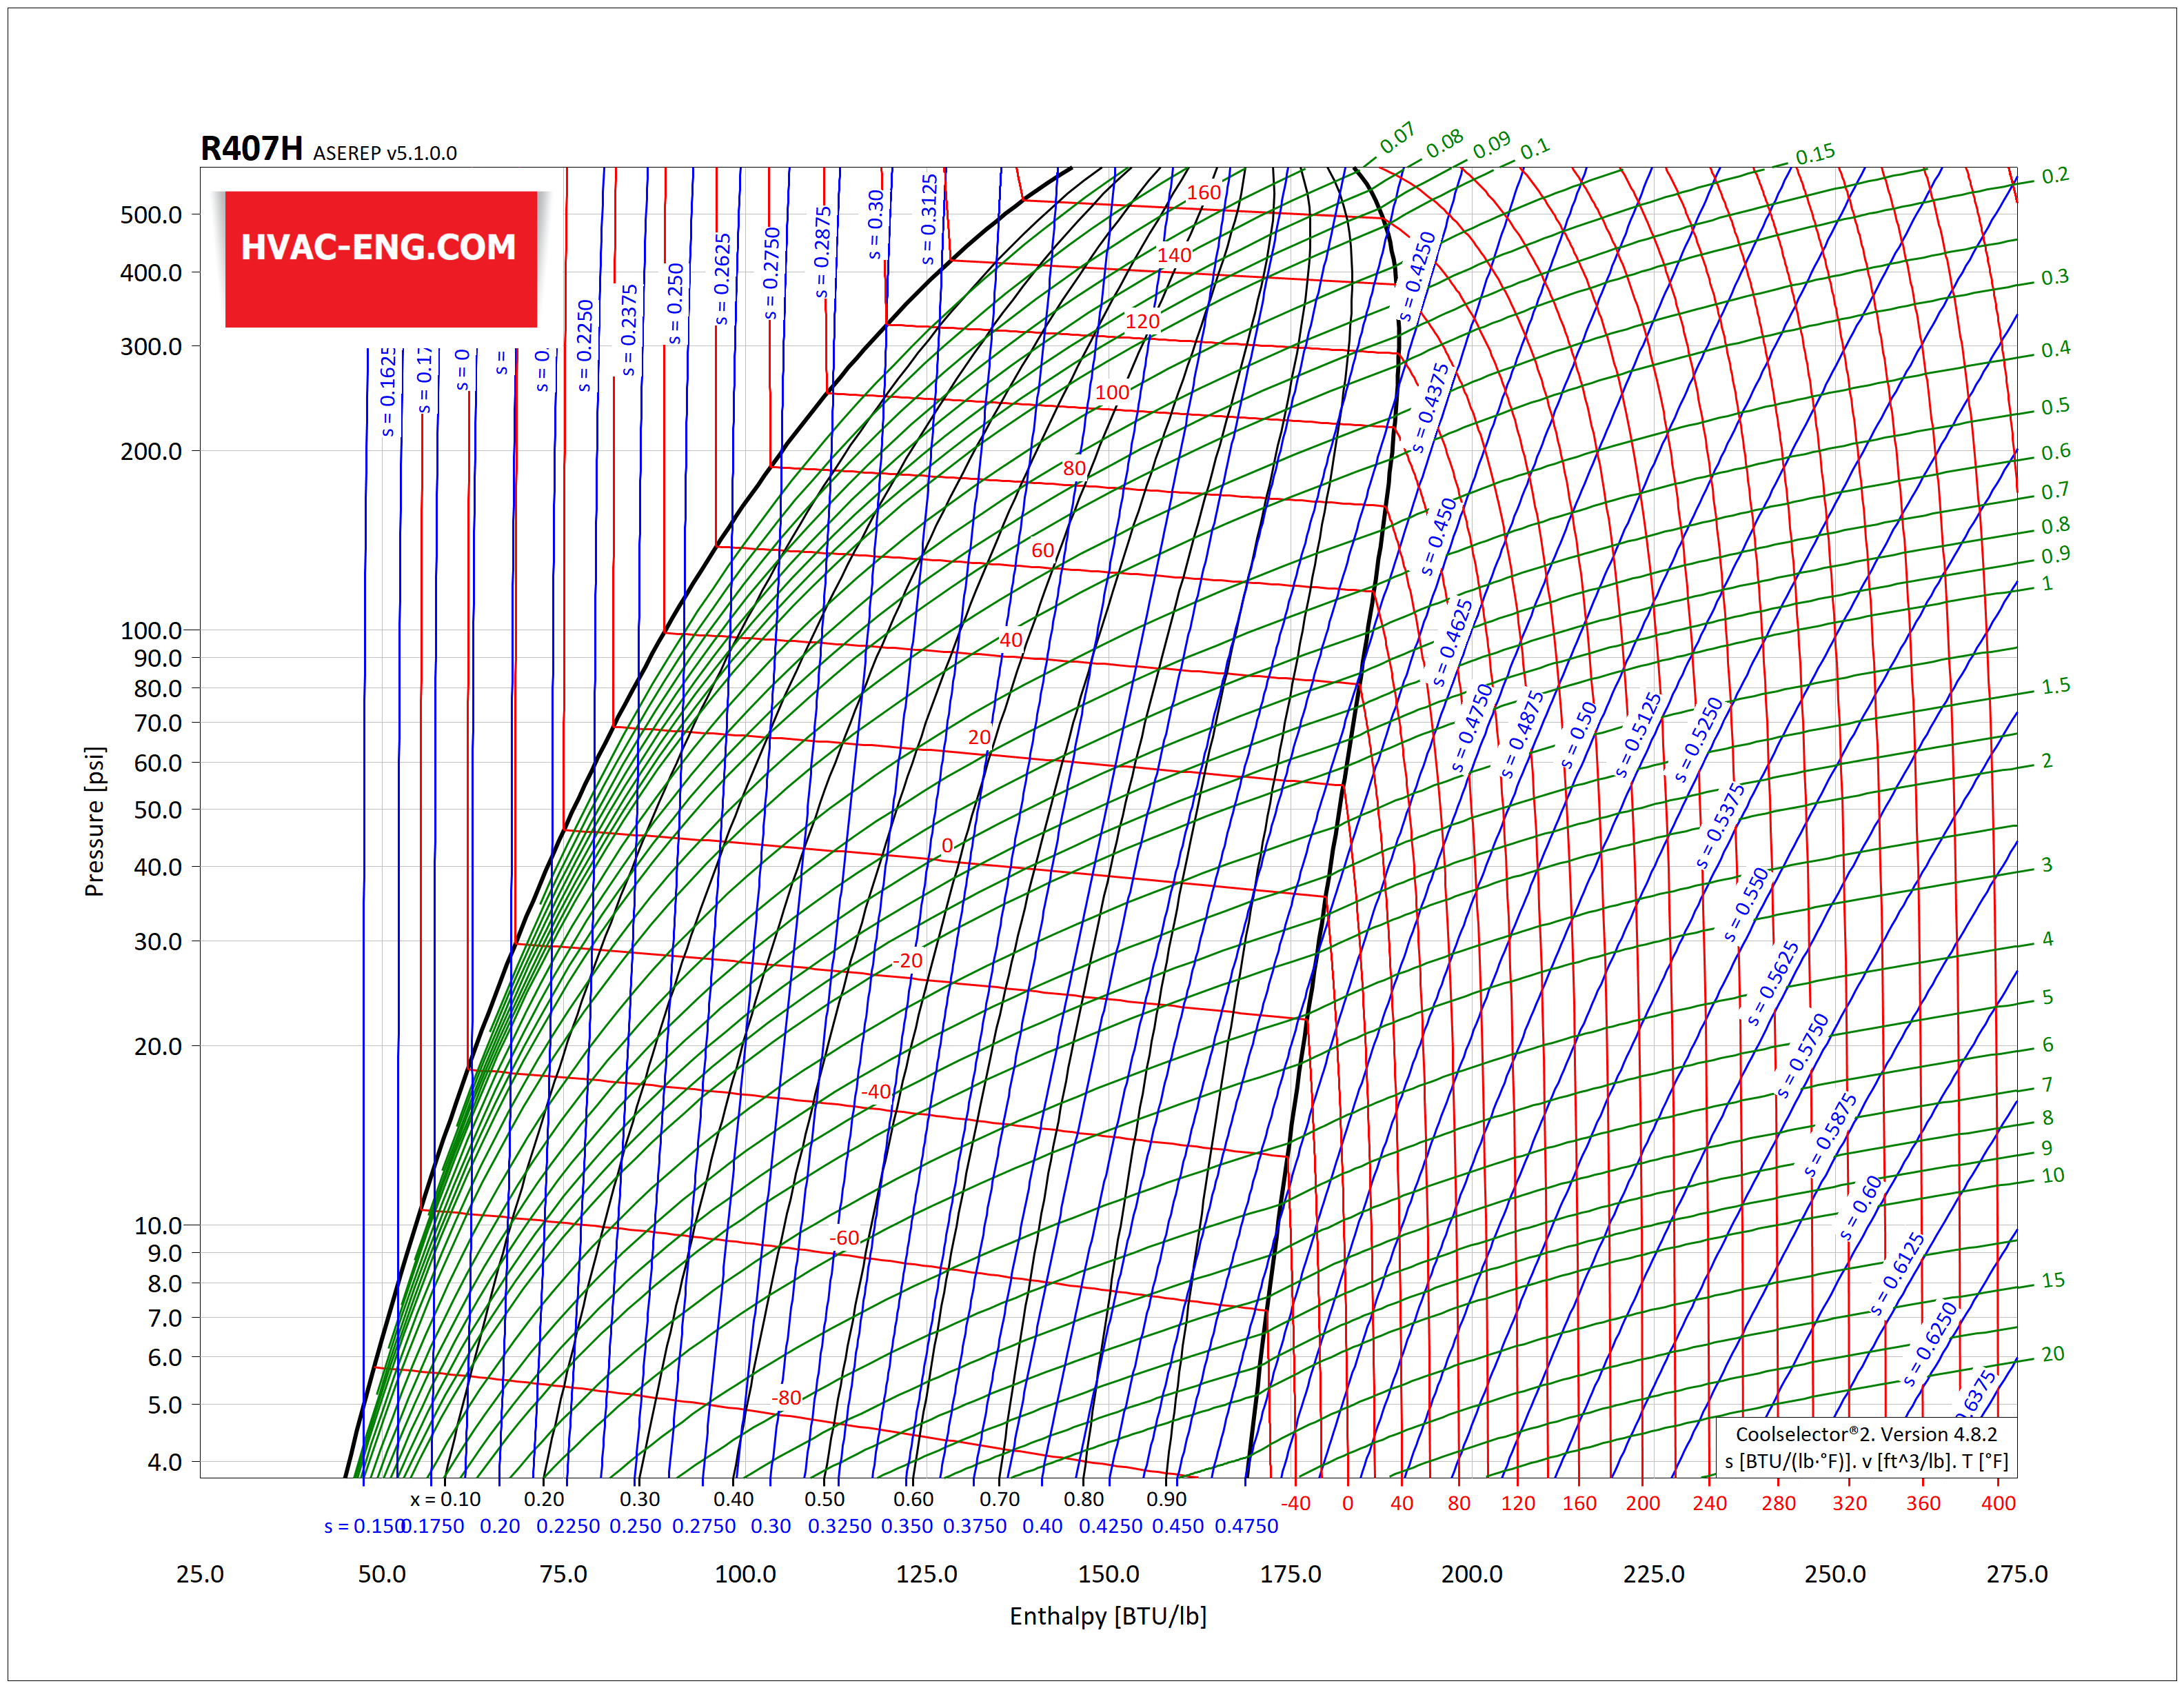
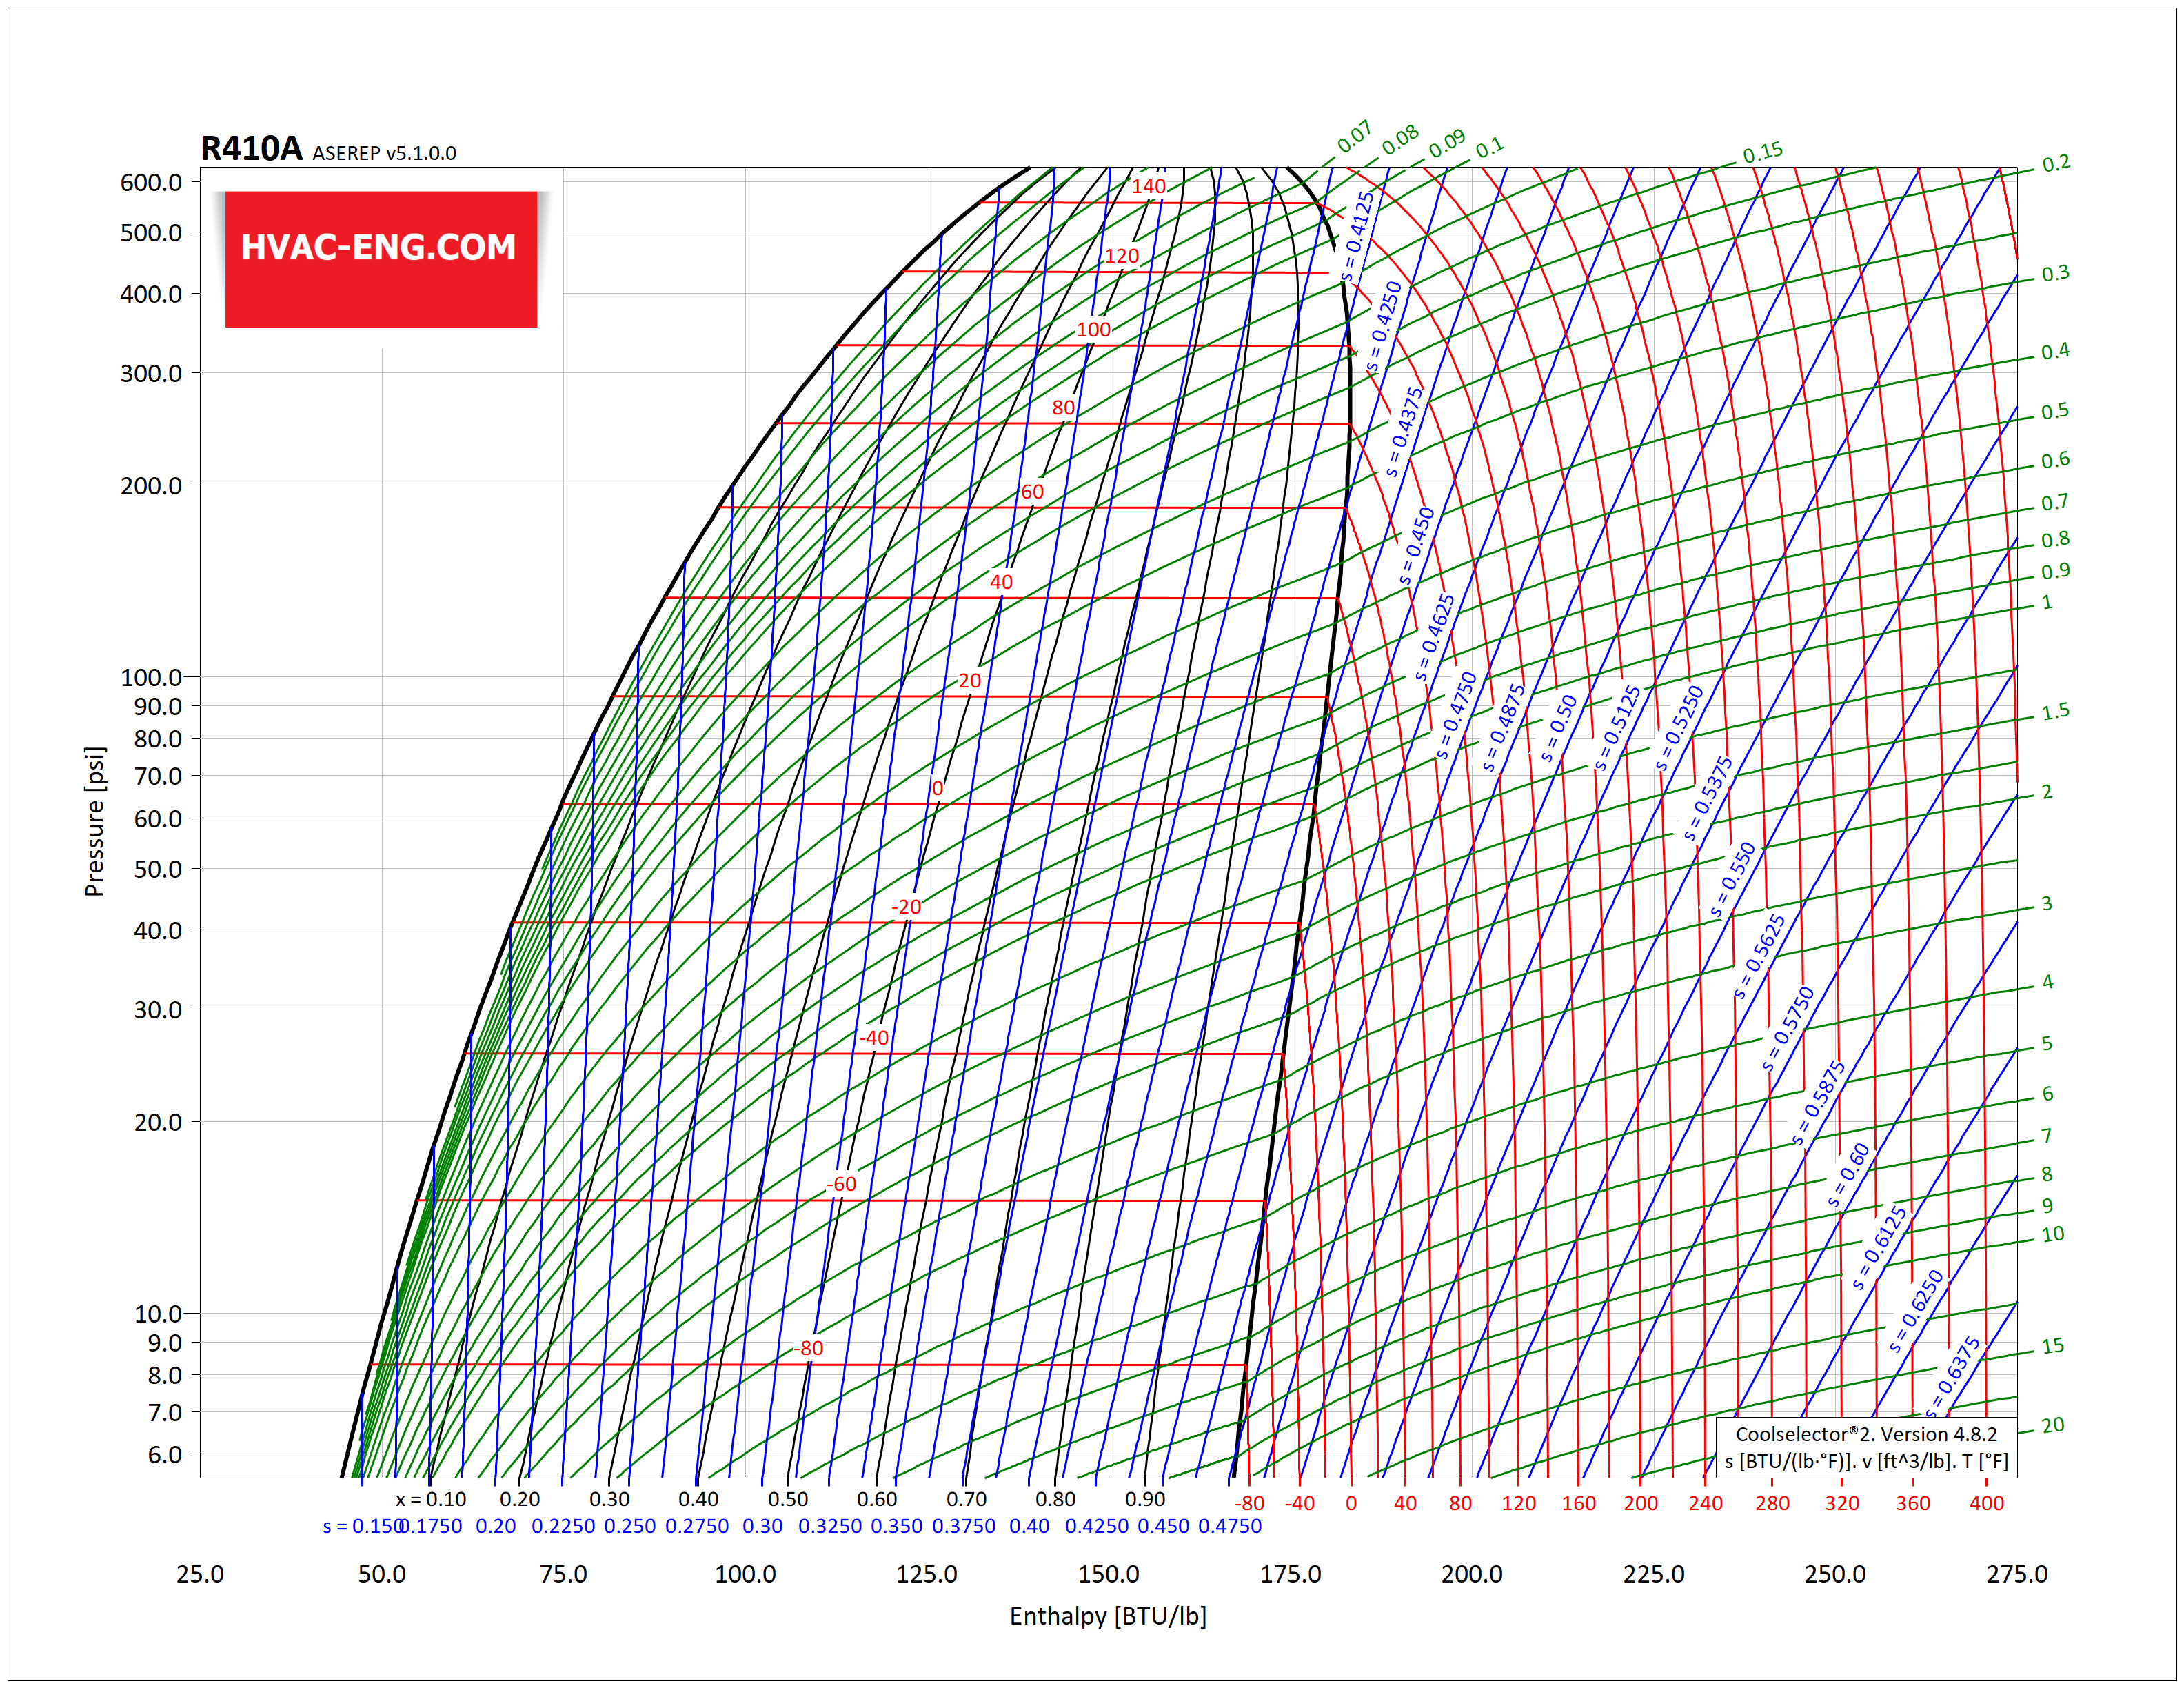
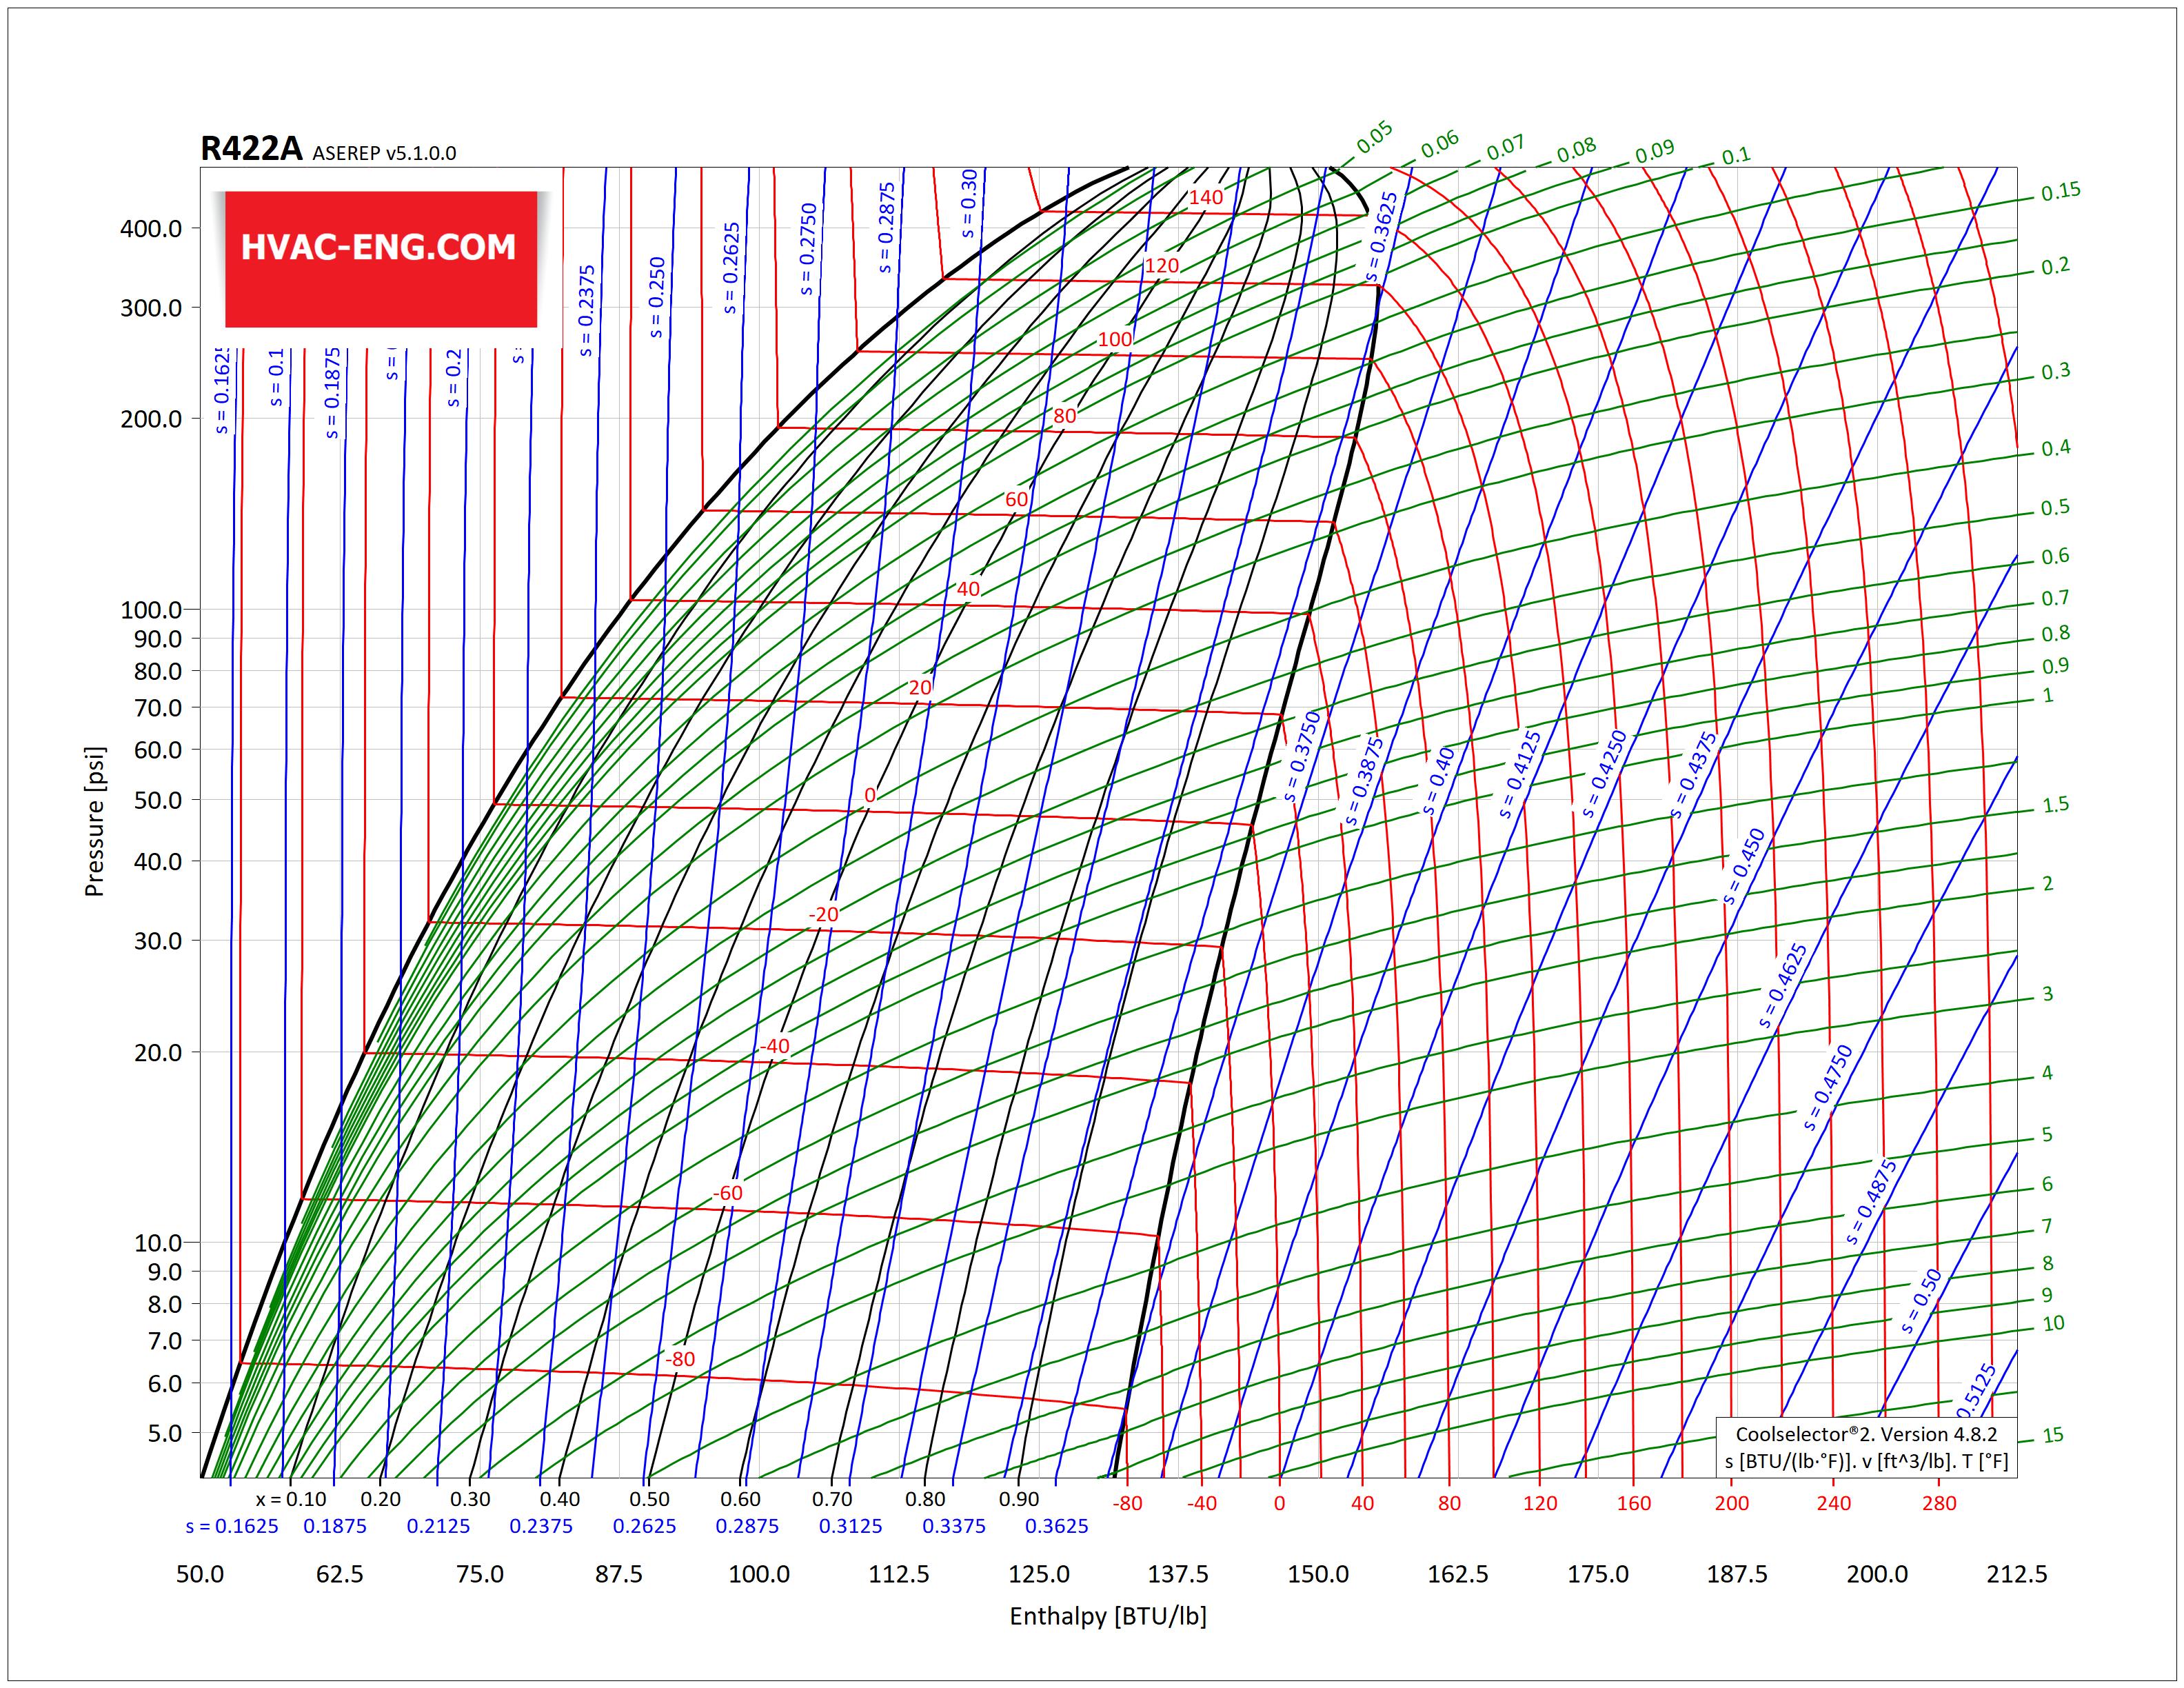
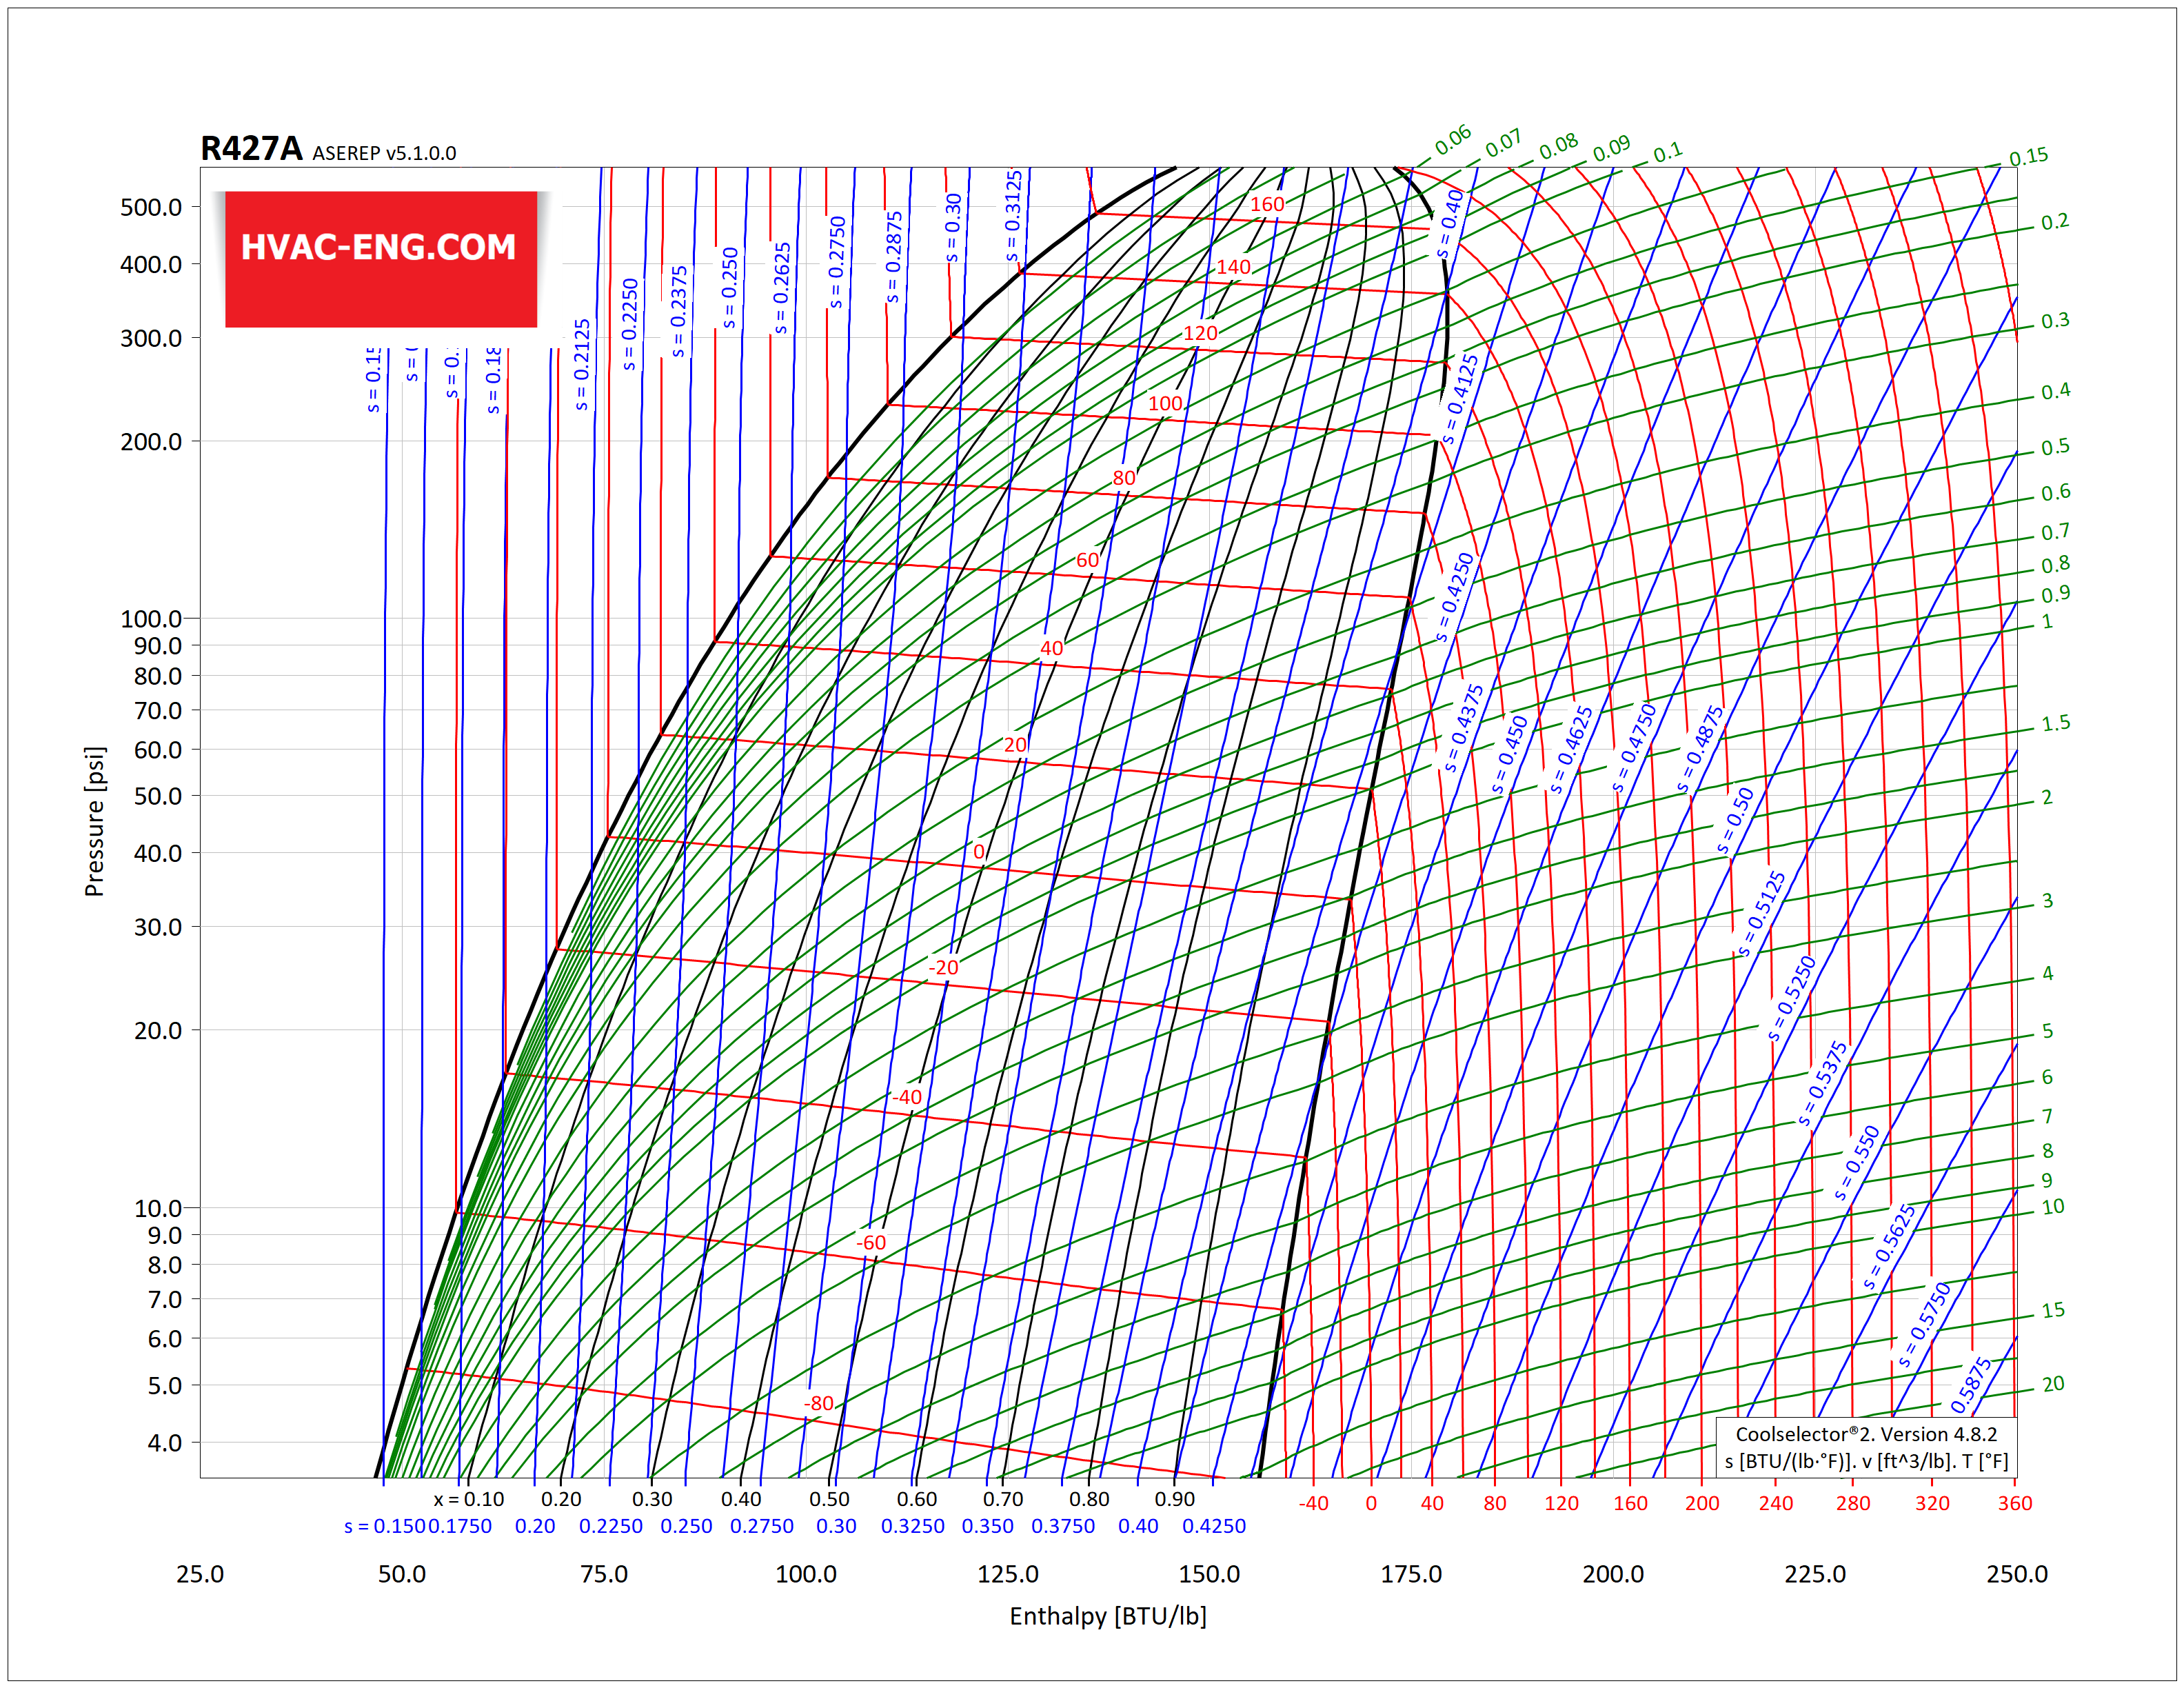
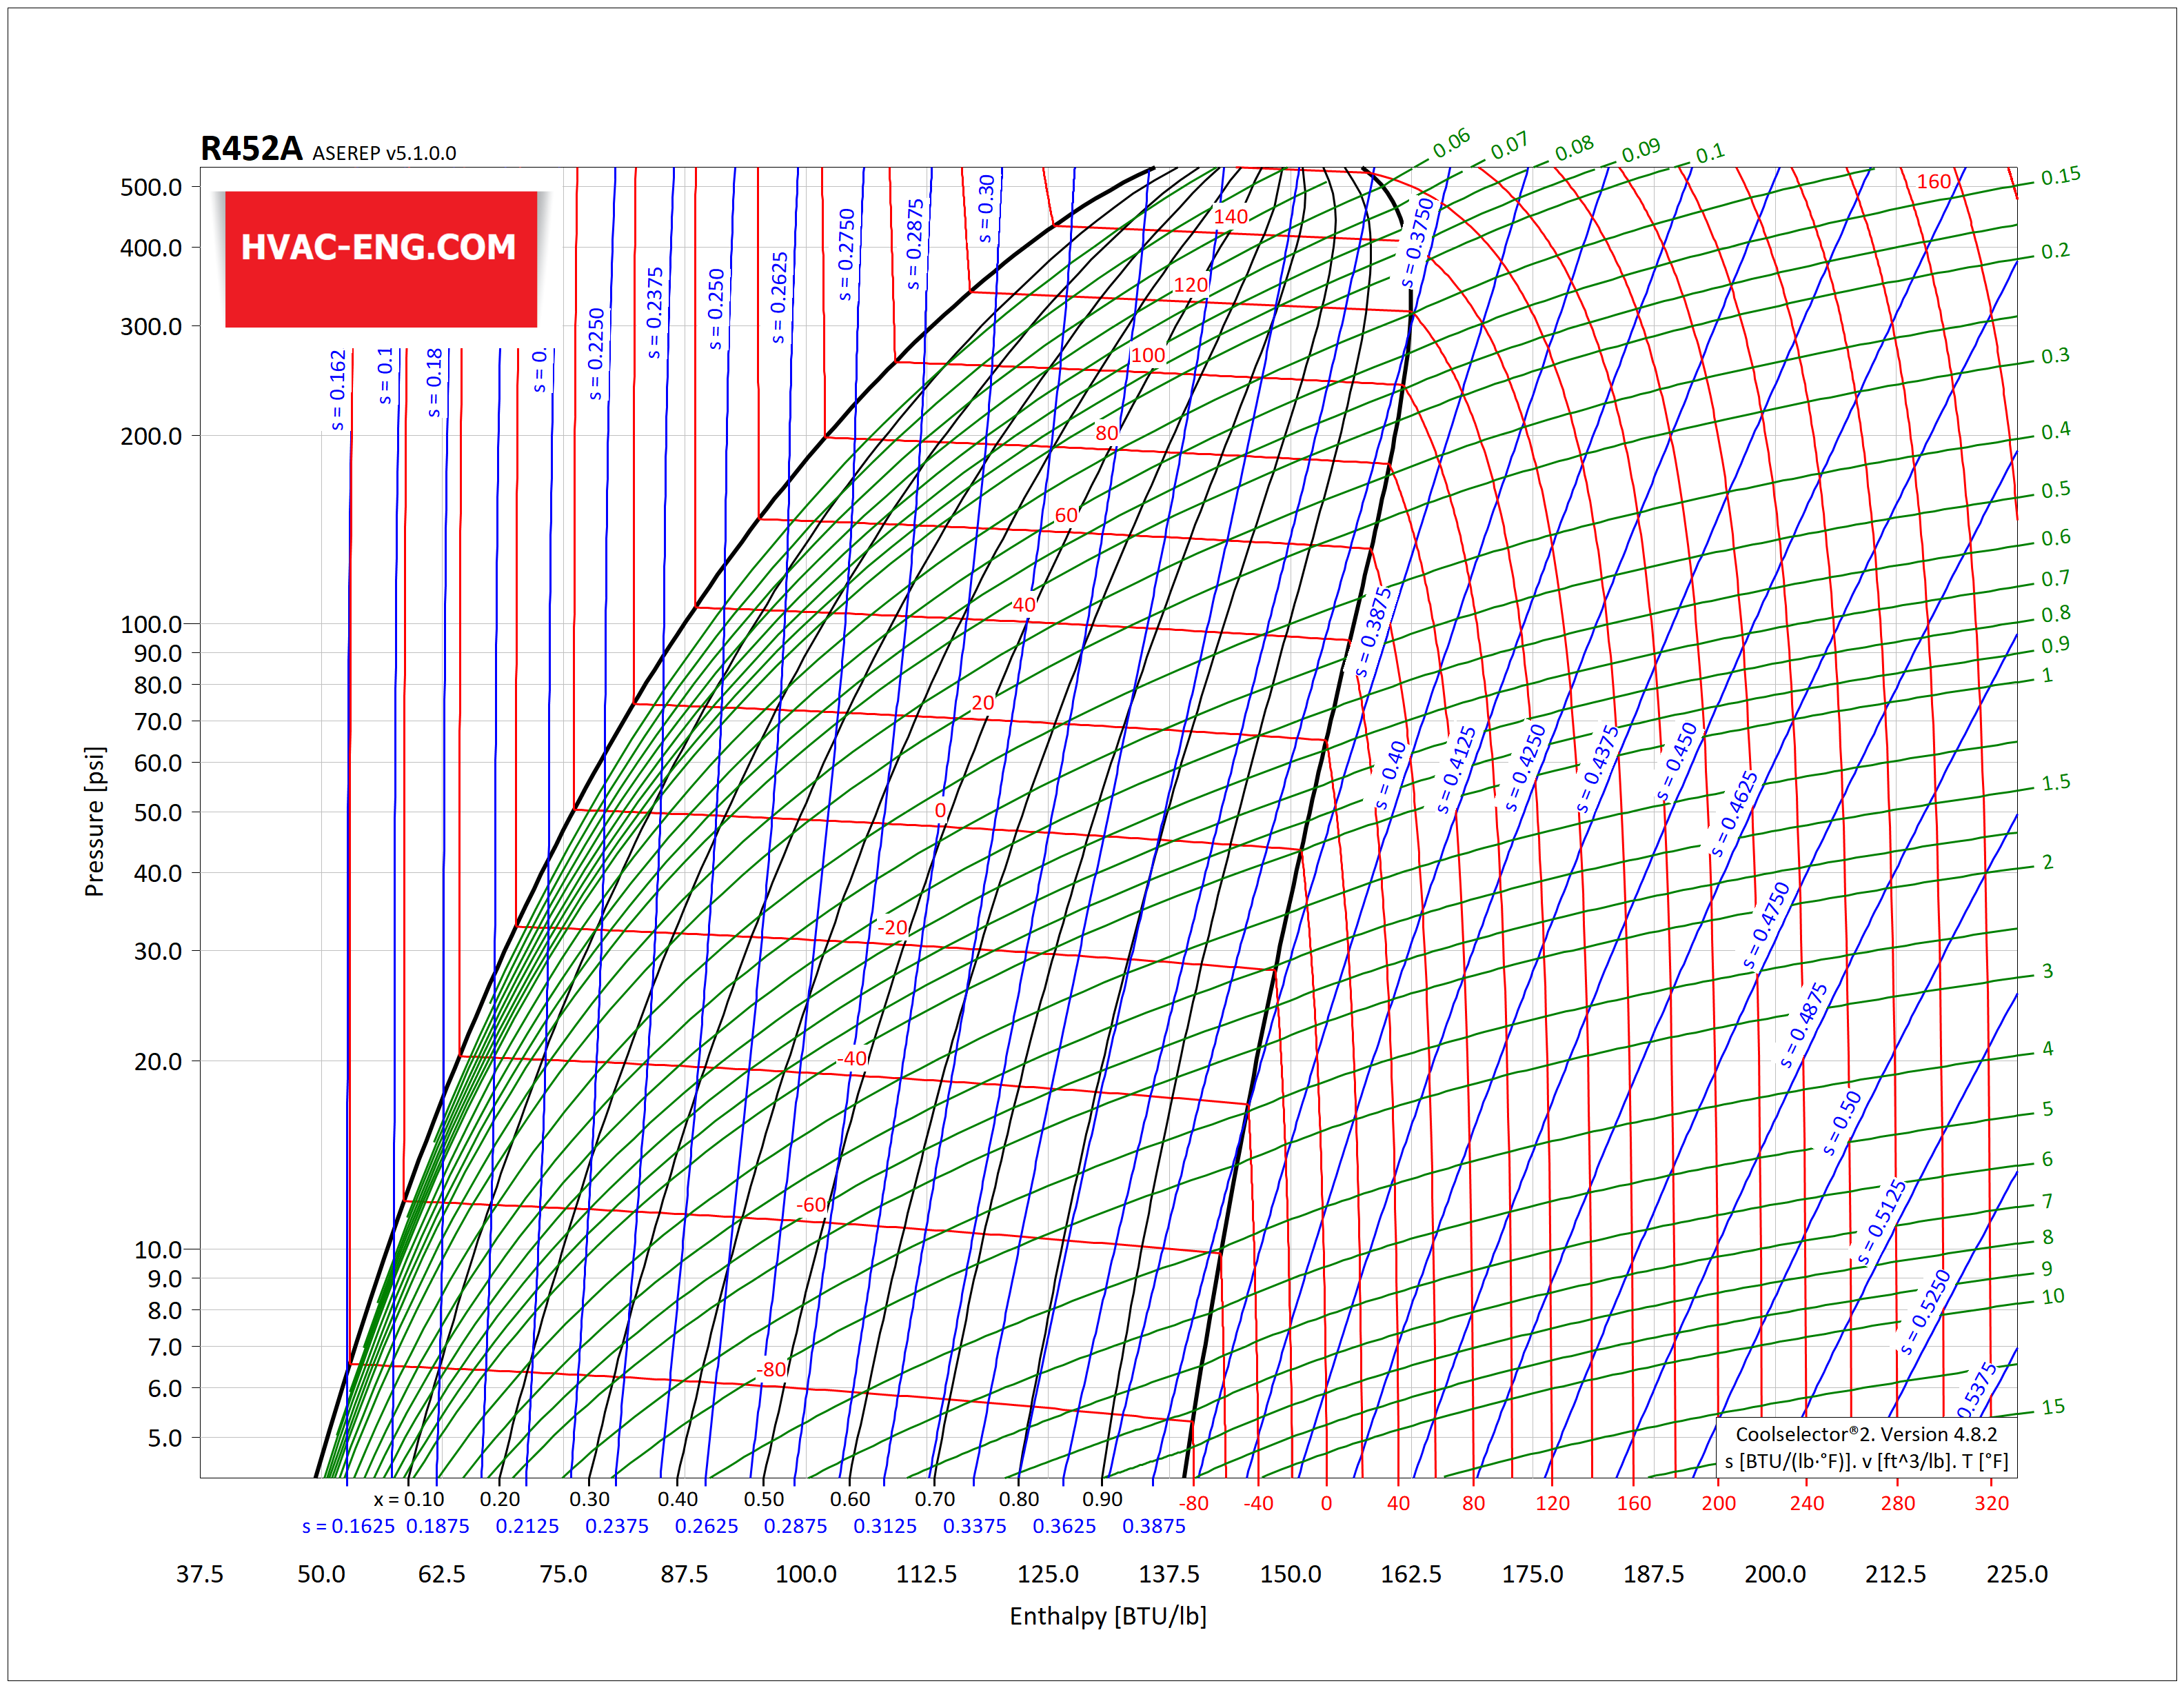
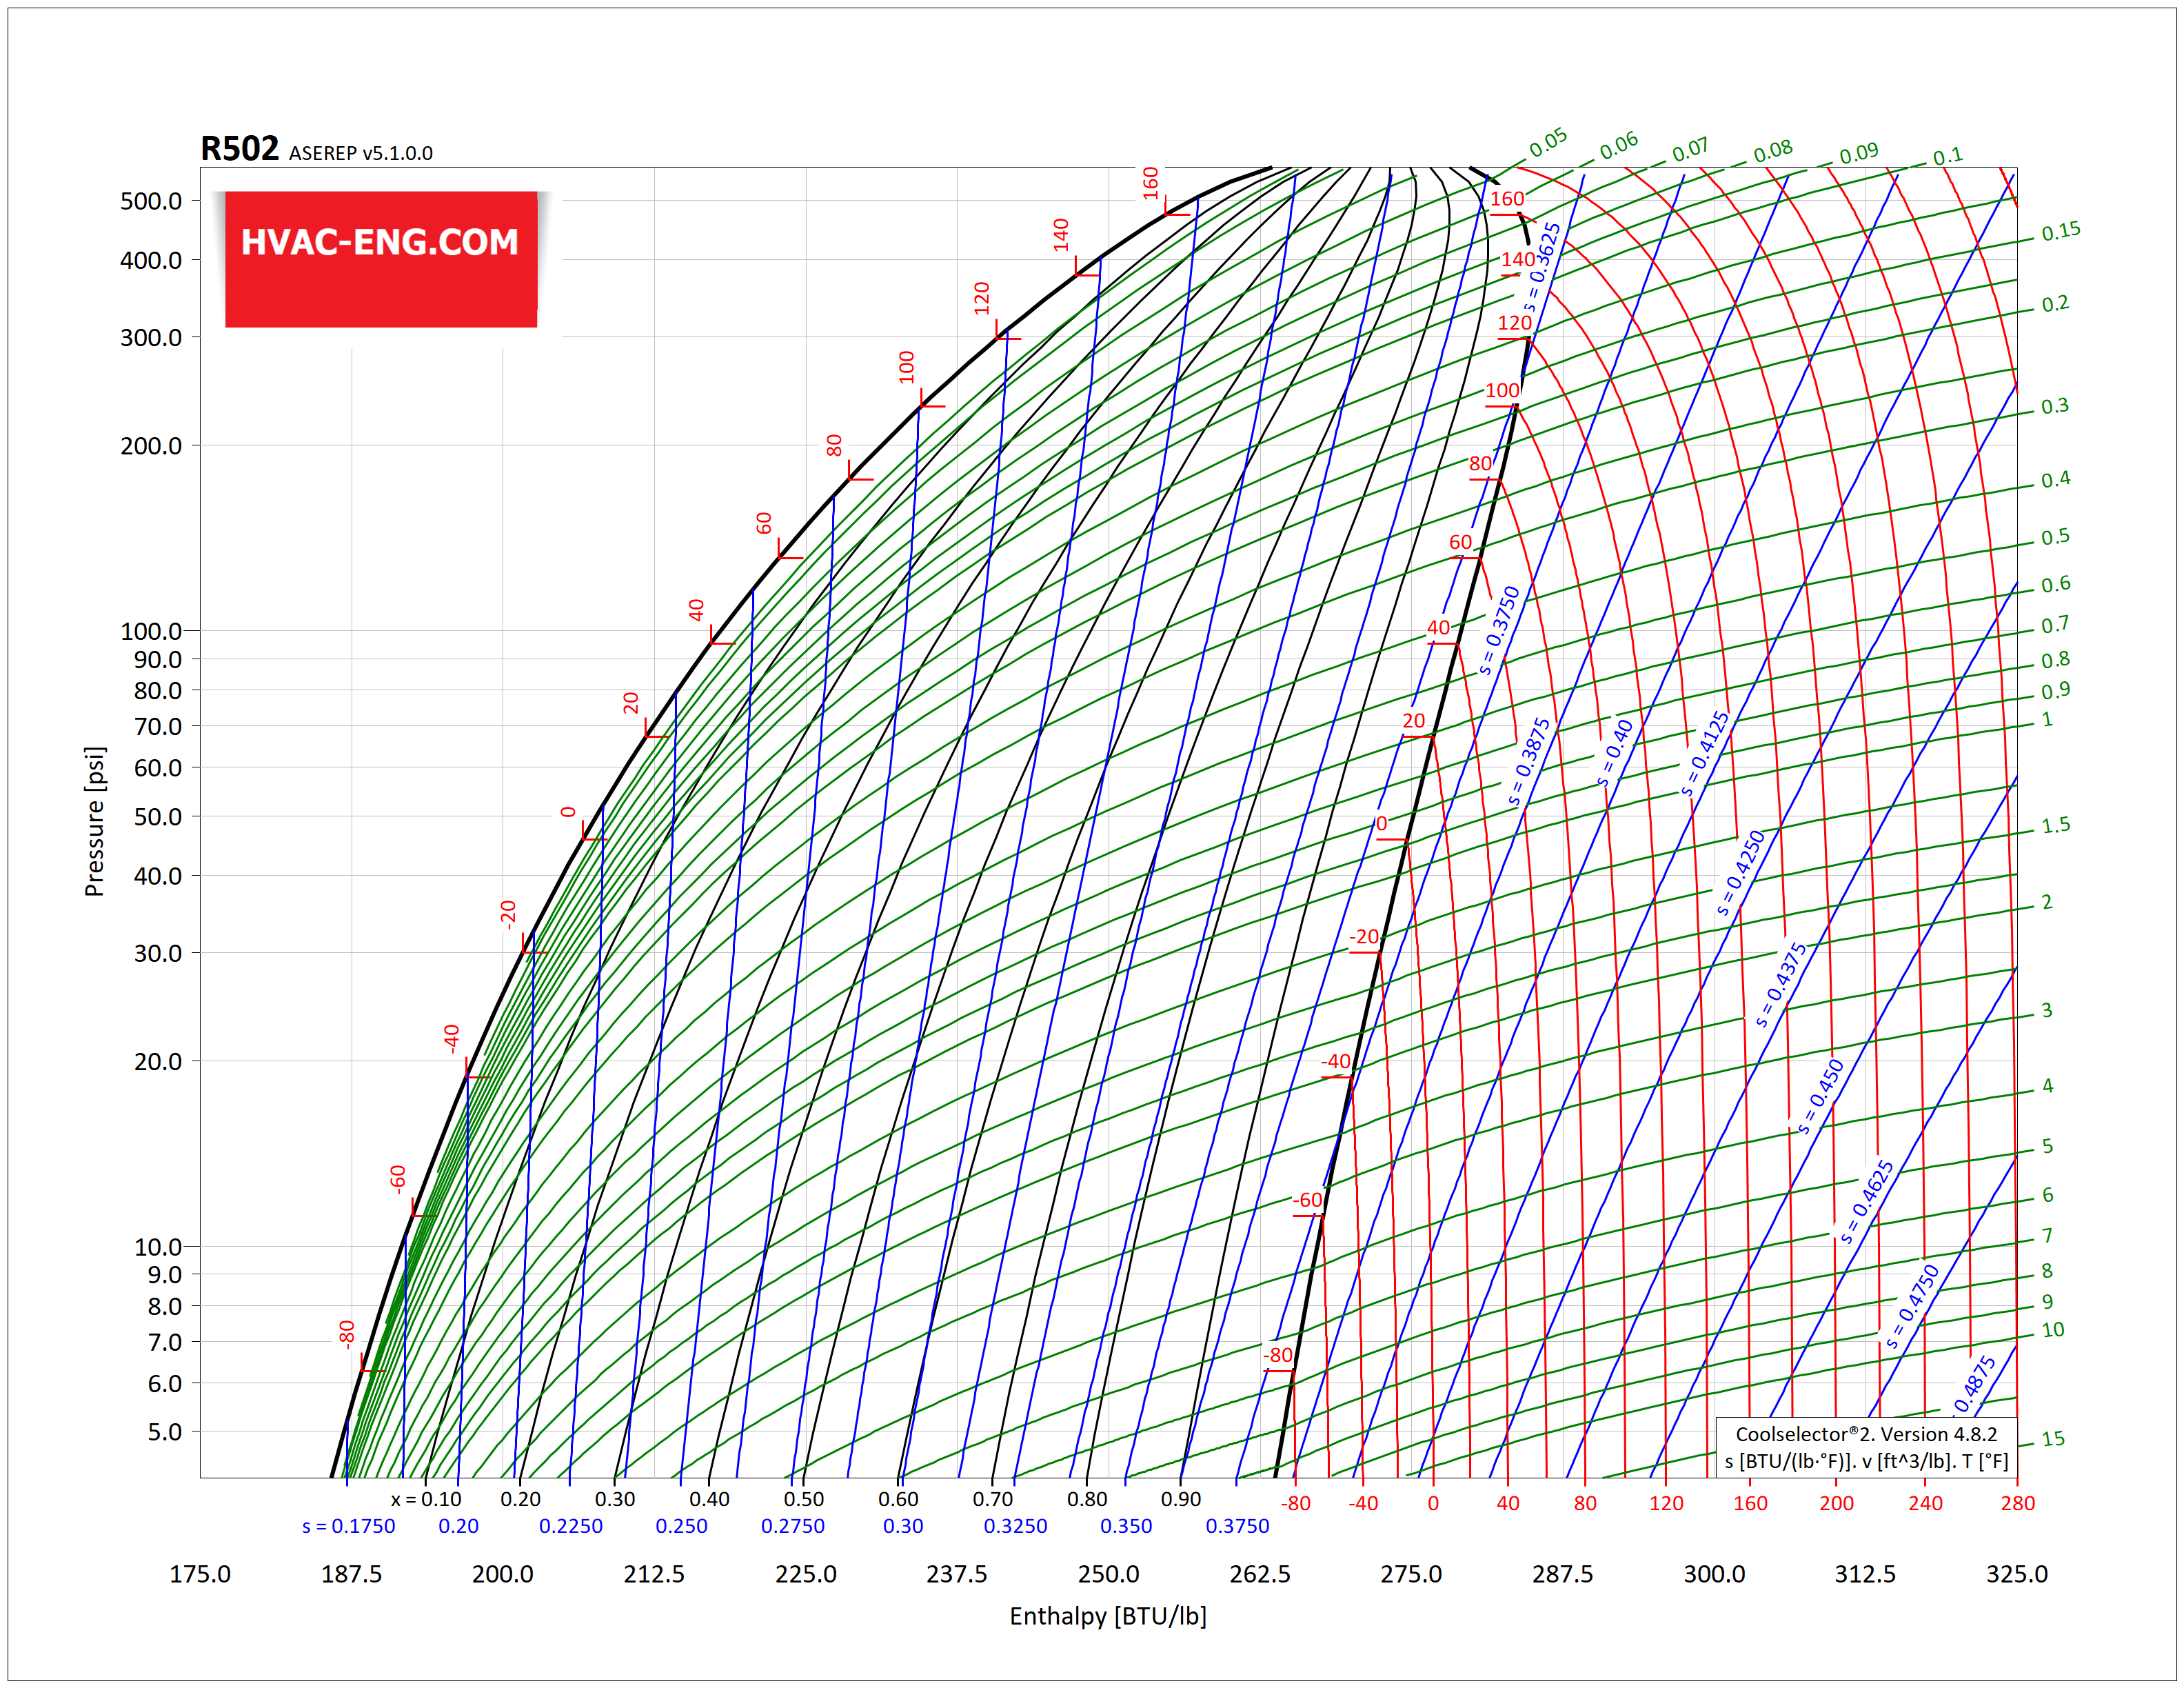
Das Druck-Enthalpie-Diagramm ist das gebräuchlichste grafische Hilfsmittel zur Analyse und Berechnung der Wärme- und Arbeitsübertragung sowie der Leistung eines Kältekreislaufs. Die Druckveränderung lässt sich im ph-Diagramm gut darstellen. Außerdem können sowohl die Wärme- als auch die Arbeitsübertragung verschiedener Prozesse als Enthalpieänderung berechnet und leicht im pH-Diagramm dargestellt werden.

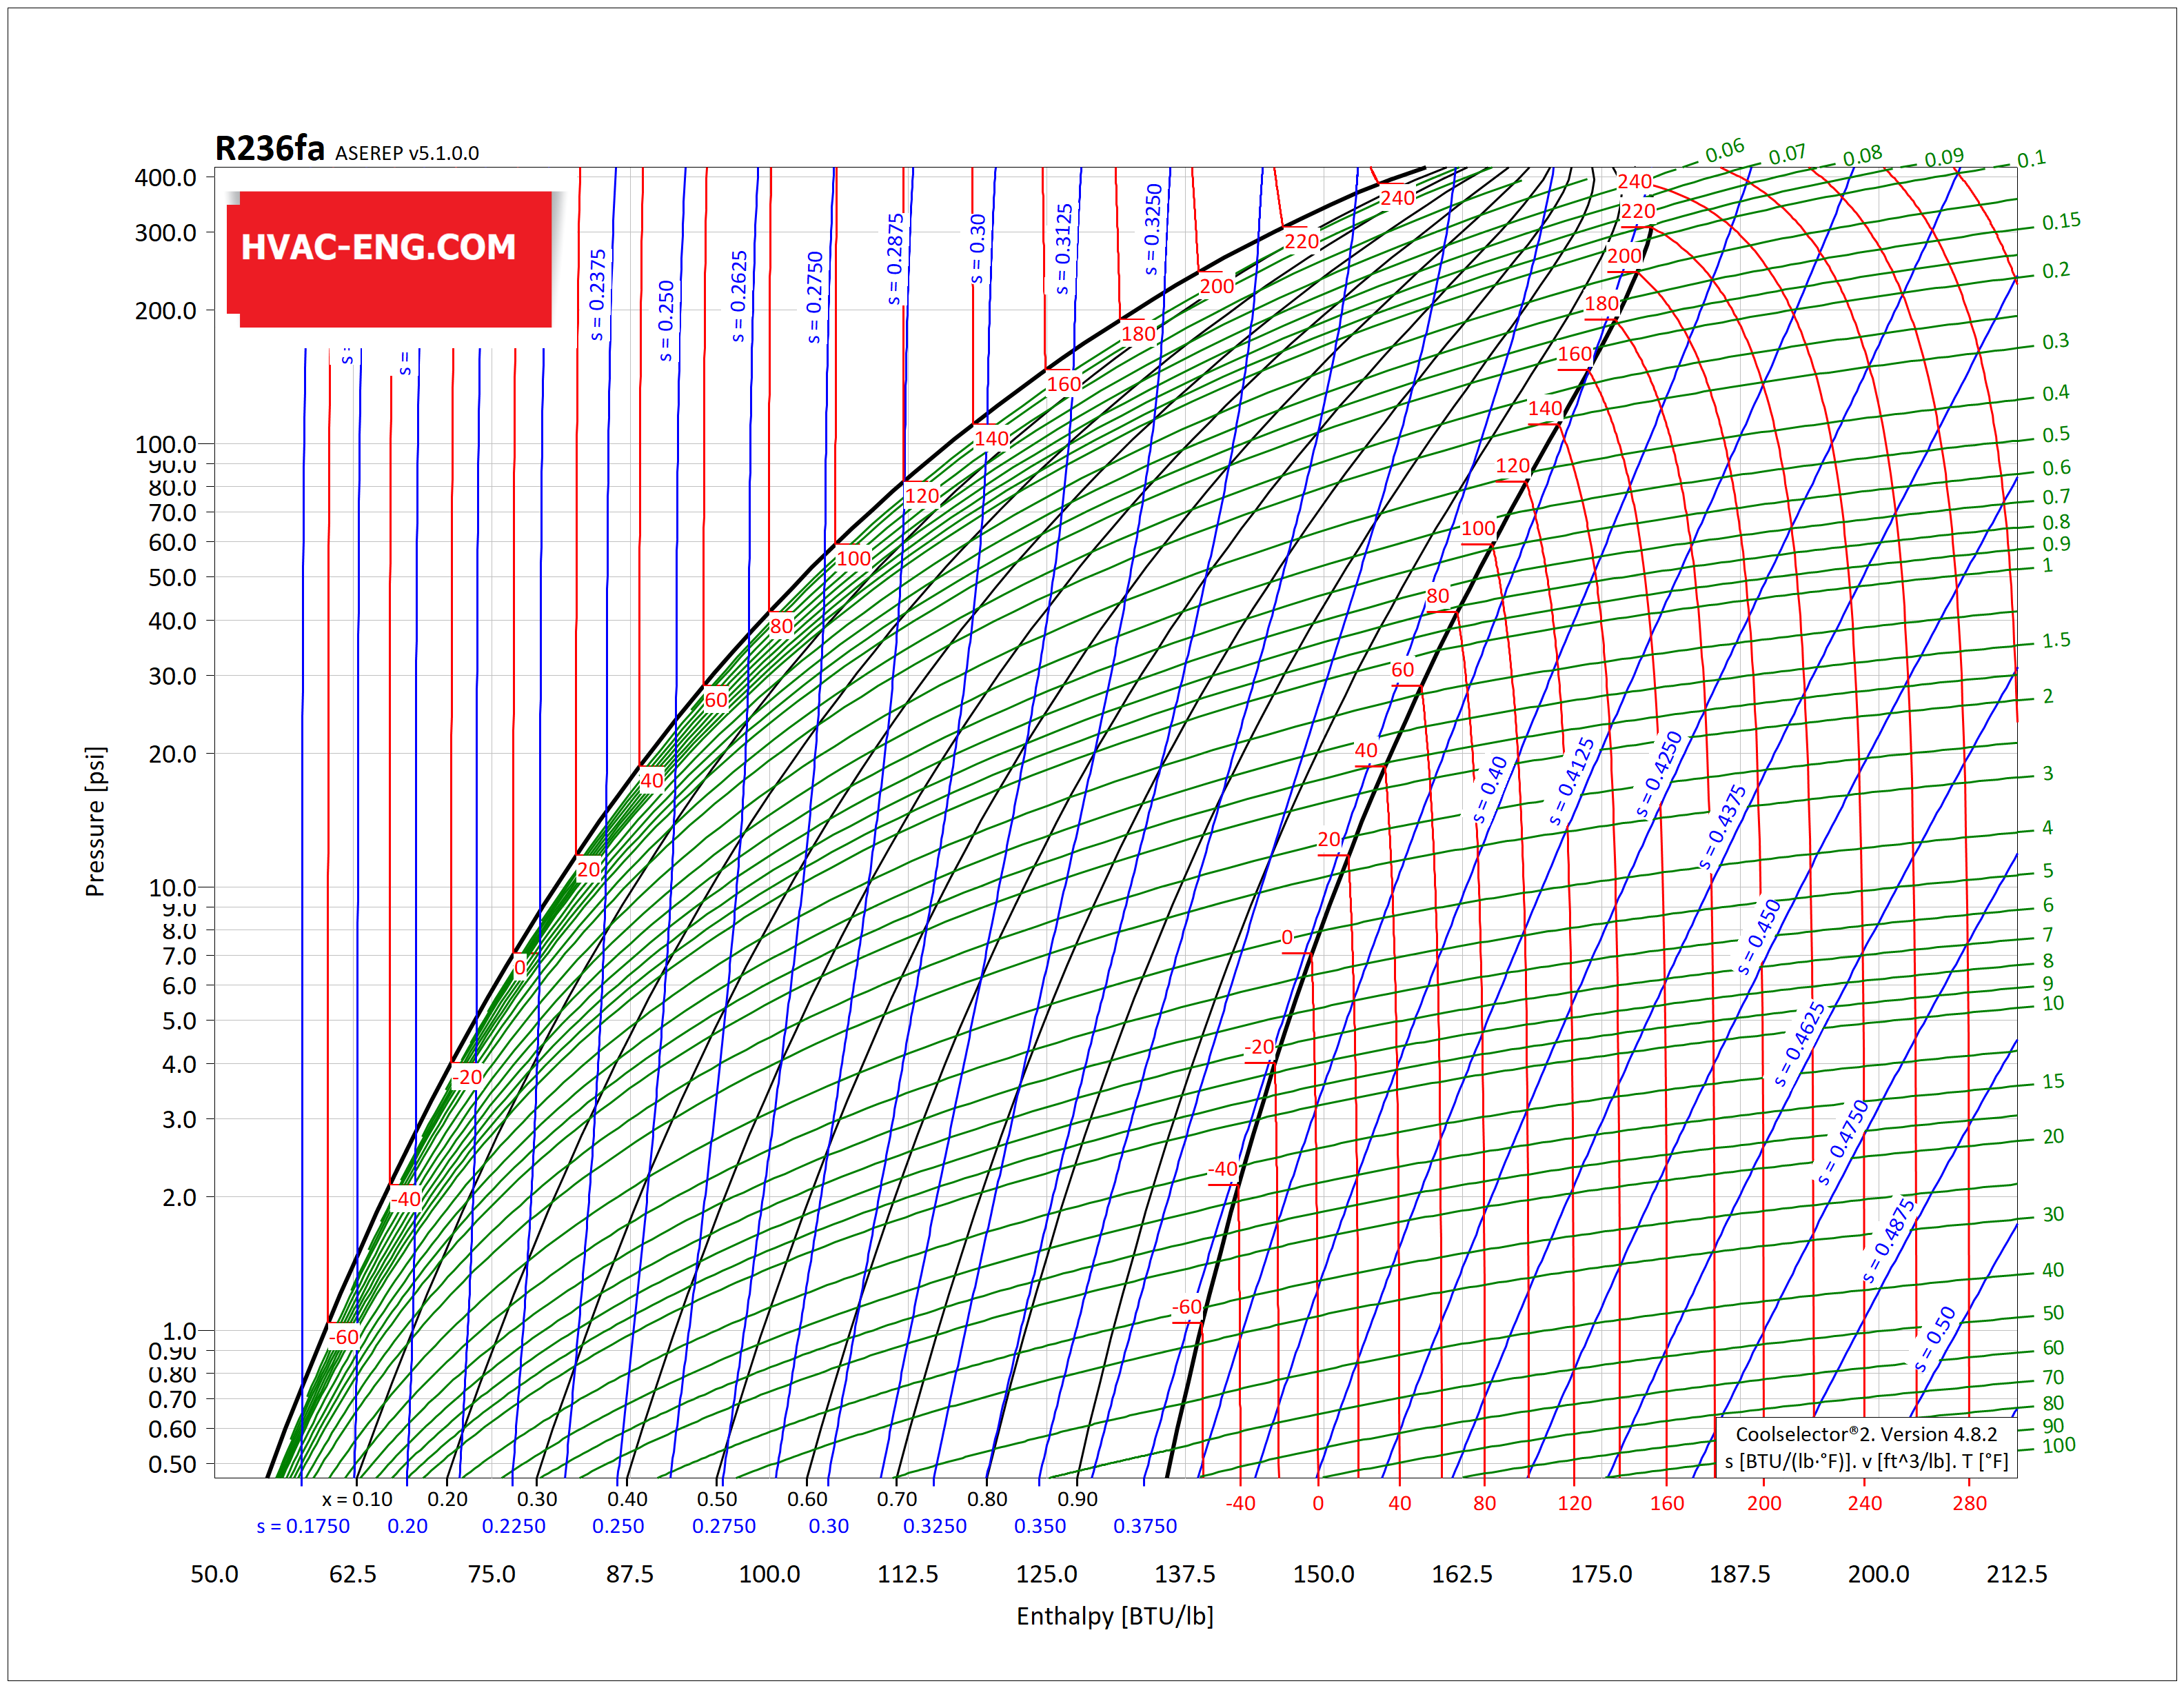
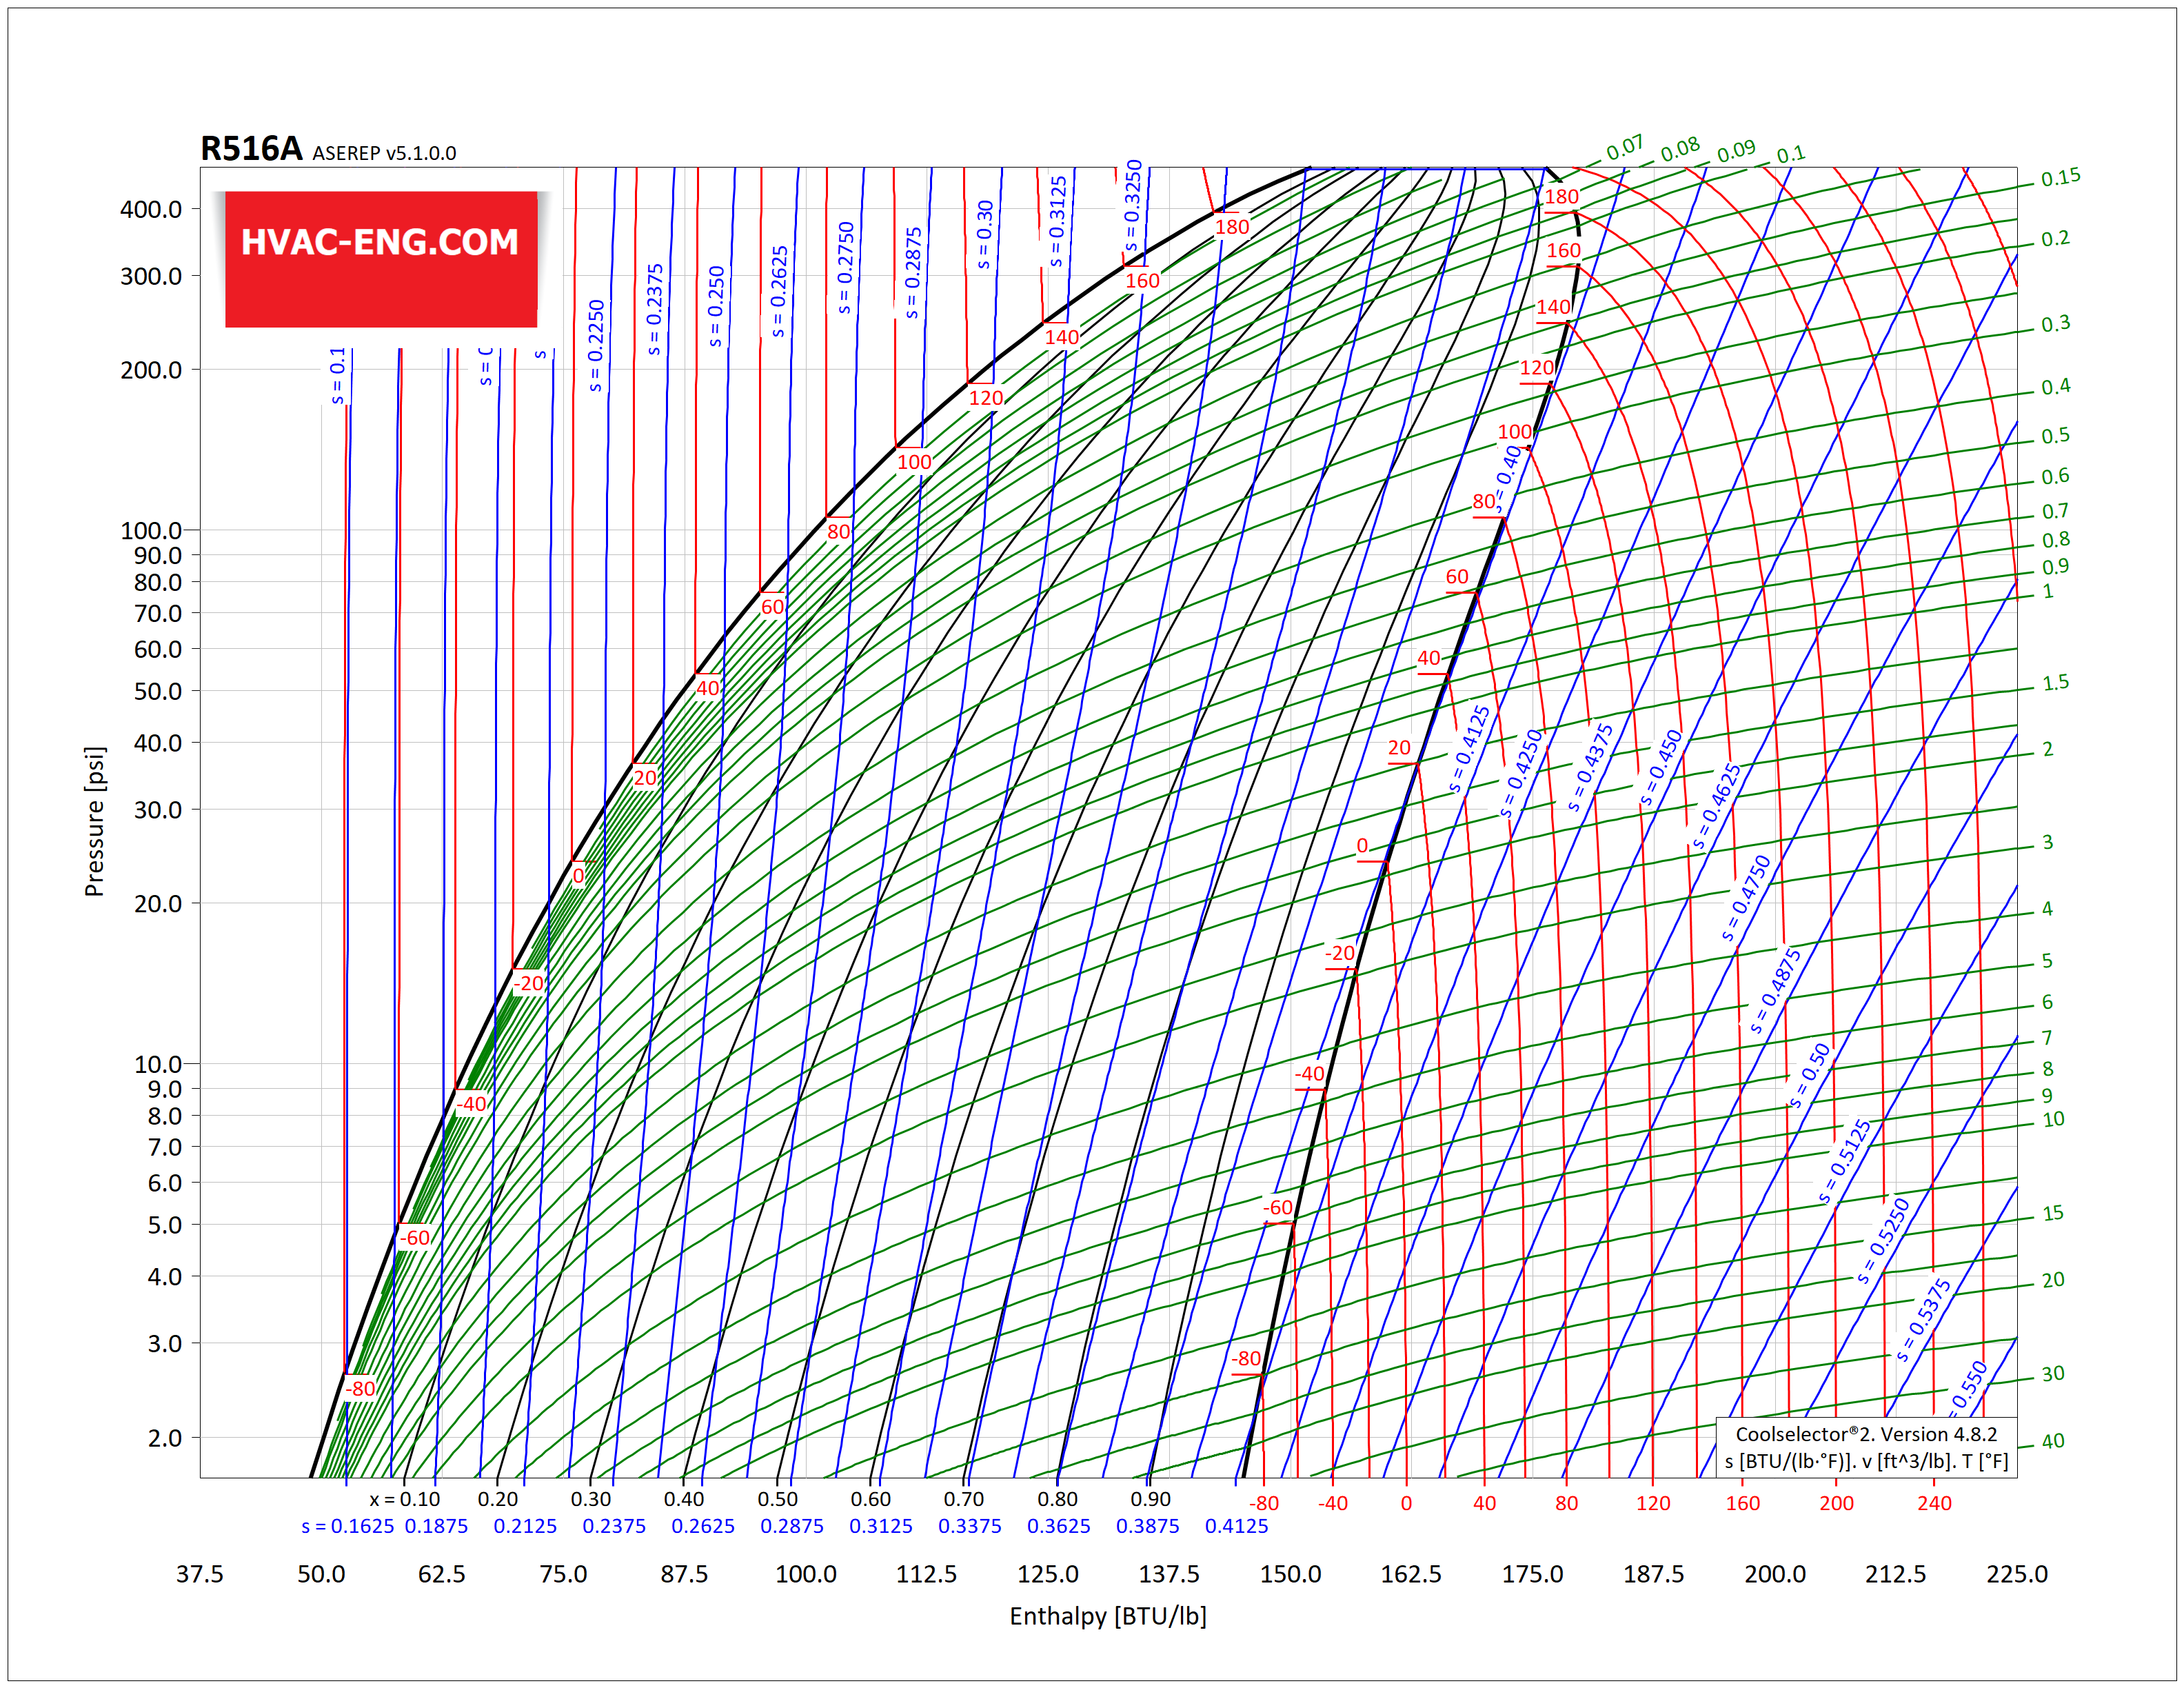
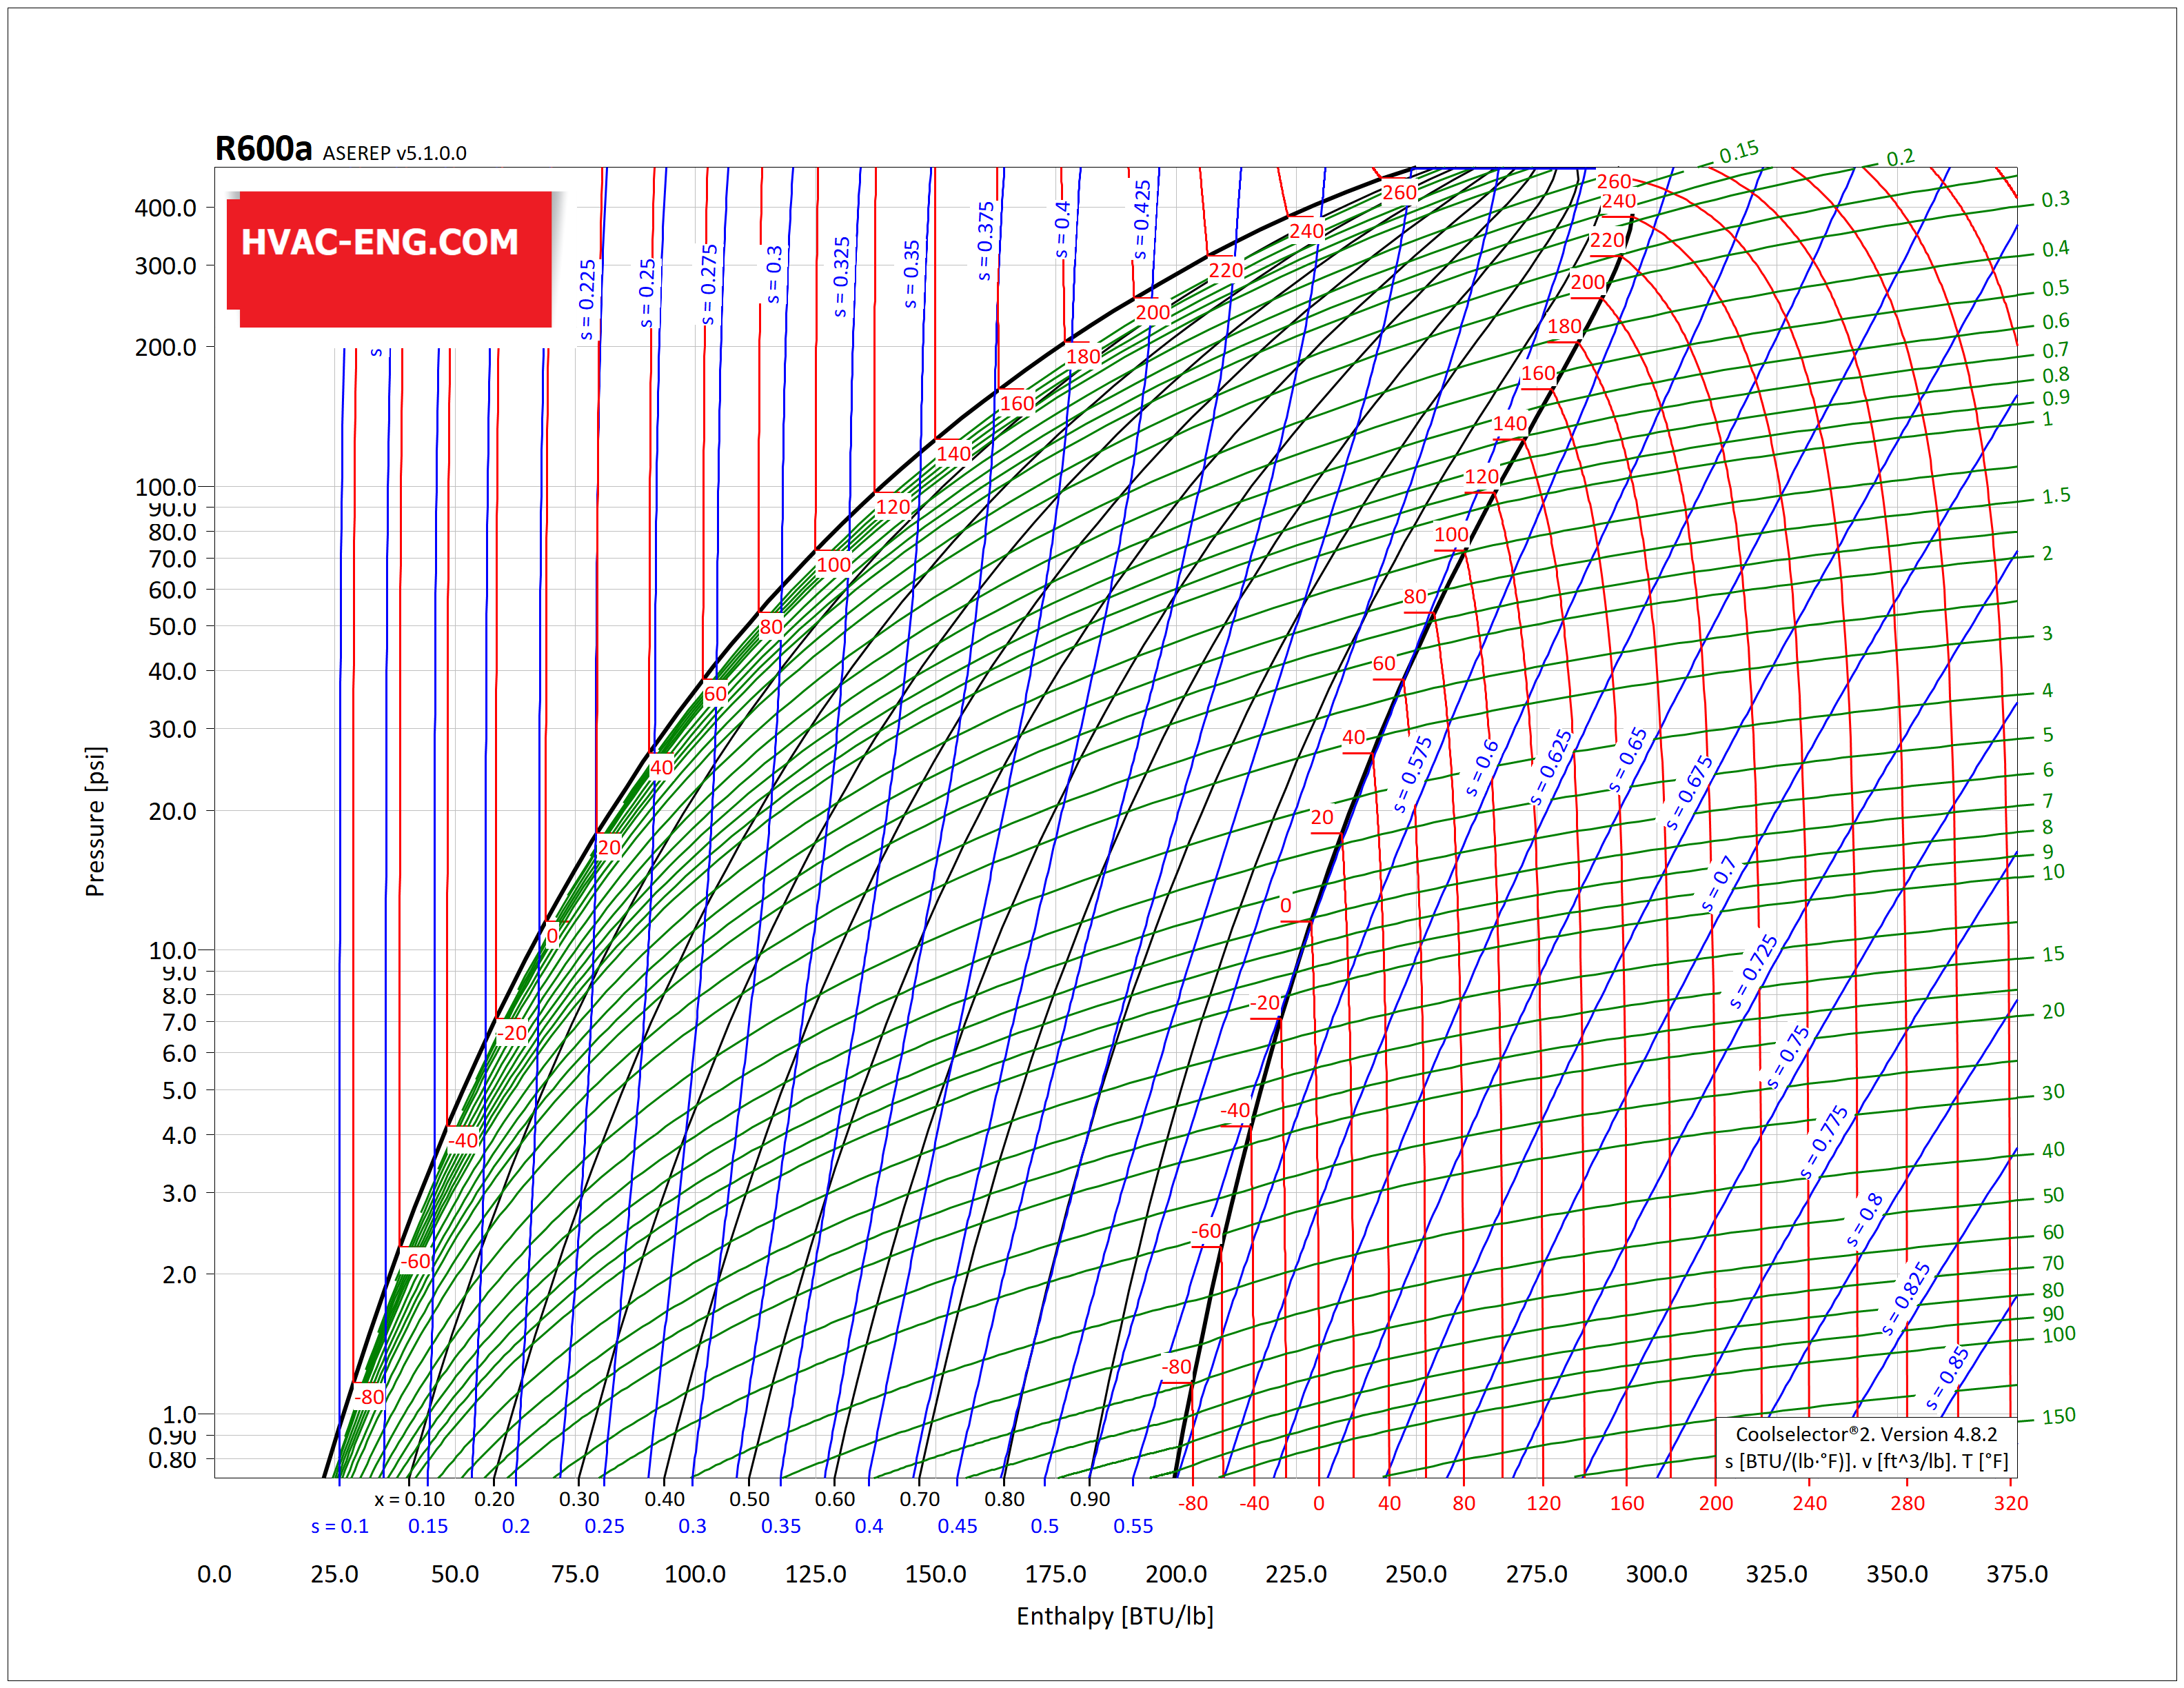
DOWNLOAD – P-h enthalpy diagram consist of following lines:
- Constant pressure lines
- Constant enthalpy lines
- Saturation line
- Isothermal lines
- Isentropic lines
- Constant volume lines
Enthalpie “h„ist entlang der x-Achse und dem absoluten Druck“p” ist entlang der y-Achse, beide im logarithmischen maßstab ausgedrückt. Der gesättigte Flüssigkeitslinie trennt die unterkühlte Flüssigkeit vom Zweiphasenbereich, in dem dampfförmige und flüssige Kältemittel nebeneinander existieren. Der gesättigte Dampflinie trennt dieses Zweiphasengebiet vom überhitzten Dampf. Im Zweiphasenbereich unterteilt die Qualitätslinie mit konstantem Trockenheitsanteil das Gemisch aus Dampf und Flüssigkeit. Der konstante Temperatur die Linien verlaufen im Bereich der unterkühlten Flüssigkeit nahezu vertikal. Bei höheren Temperaturen liegen die Kurven nahe der Linie der gesättigten Flüssigkeit. Im Zweiphasenbereich verlaufen die Konstanttemperaturlinien horizontal. Auch im überhitzten Bereich ist die konstante Entropie linien neigen sich stark nach oben und Linien mit konstantem Volumen sind flacher. Beide sind leicht gebogen.
Dieser Artikel ist eine Fortsetzung unseres älter artikel, das von den Benutzern gut angenommen wurde, daher haben wir beschlossen, die Liste des PH-Diagramms zu aktualisieren und Ihnen eine vollständigere Liste der weltweit kommerziell erhältlichen Kältemittel zur Verfügung zu stellen. Sie können ganz einfach auf die hochwertige Kältemitteltabelle zugreifen, indem Sie auf die in der Tabelle aufgeführten Kältemittel klicken.


_PH_Diagram.png)
_PH_Diagram.png)
_PH_Diagram.png)
_PH_Diagram.png)
_PH_Diagram.png)
_PH_Diagram.png)
_PH_Diagram.png)
_PH_Diagram.png)